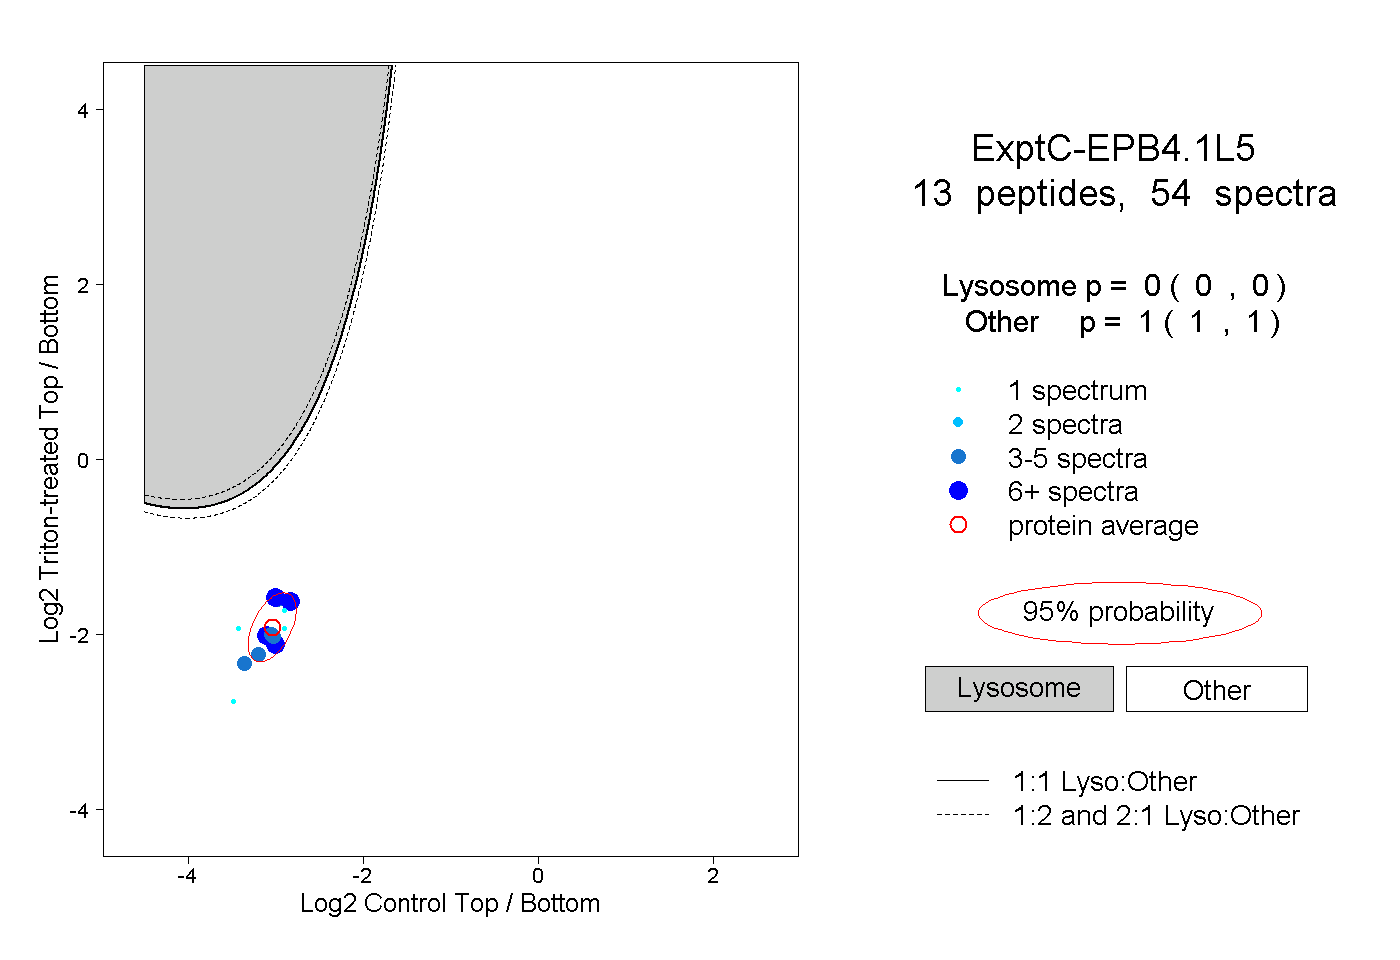
13
13peptides
spectra
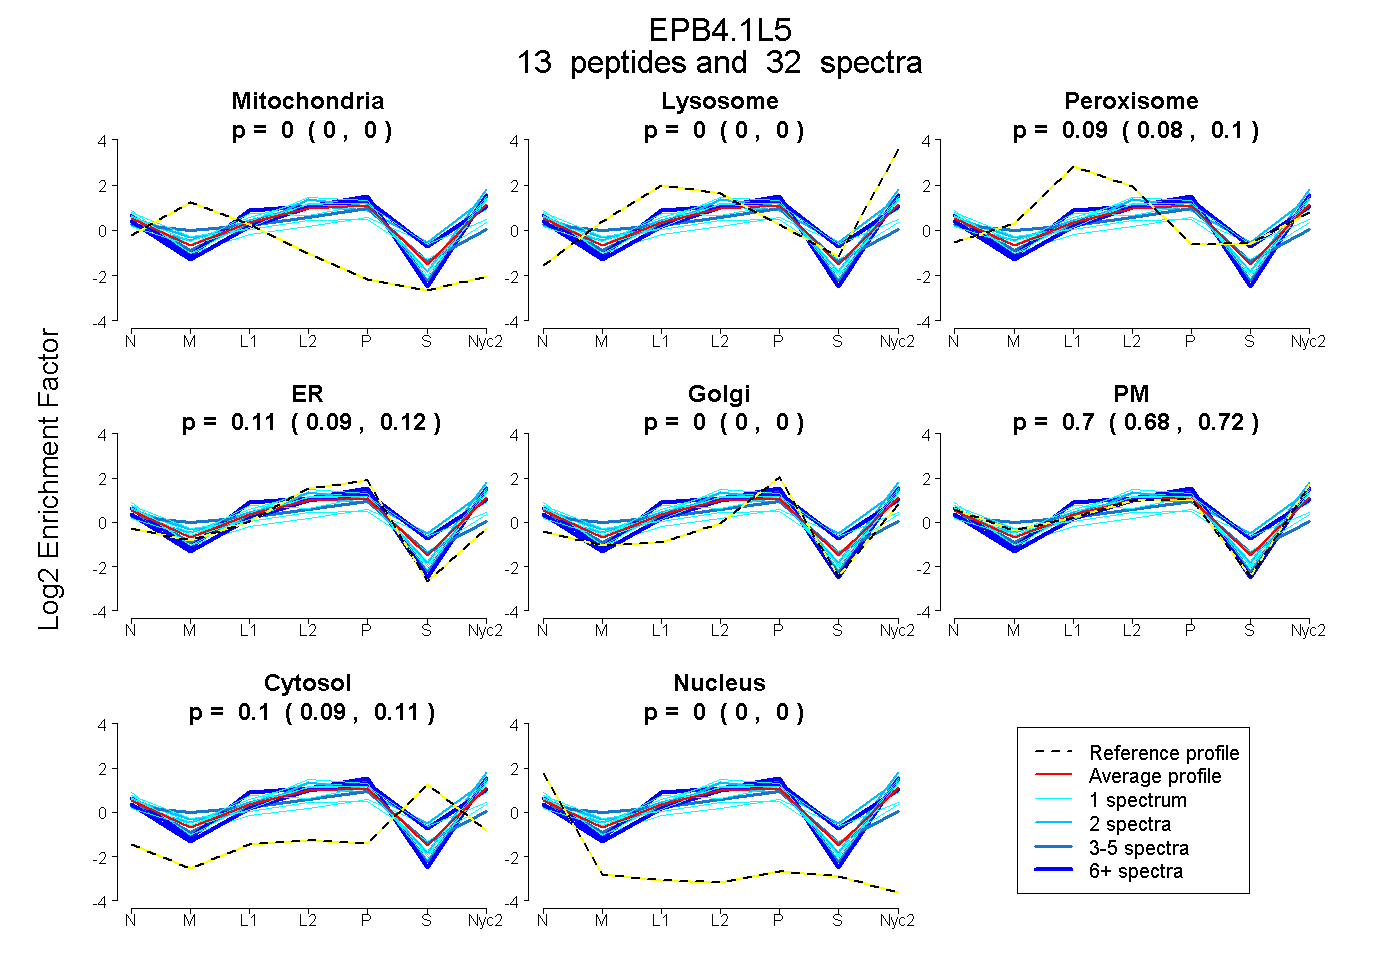
0.000 | 0.000
0.000 | 0.000
0.084 | 0.102
0.087 | 0.122
0.000 | 0.000
0.678 | 0.717
0.094 | 0.108
0.000 | 0.000
3peptides
spectra
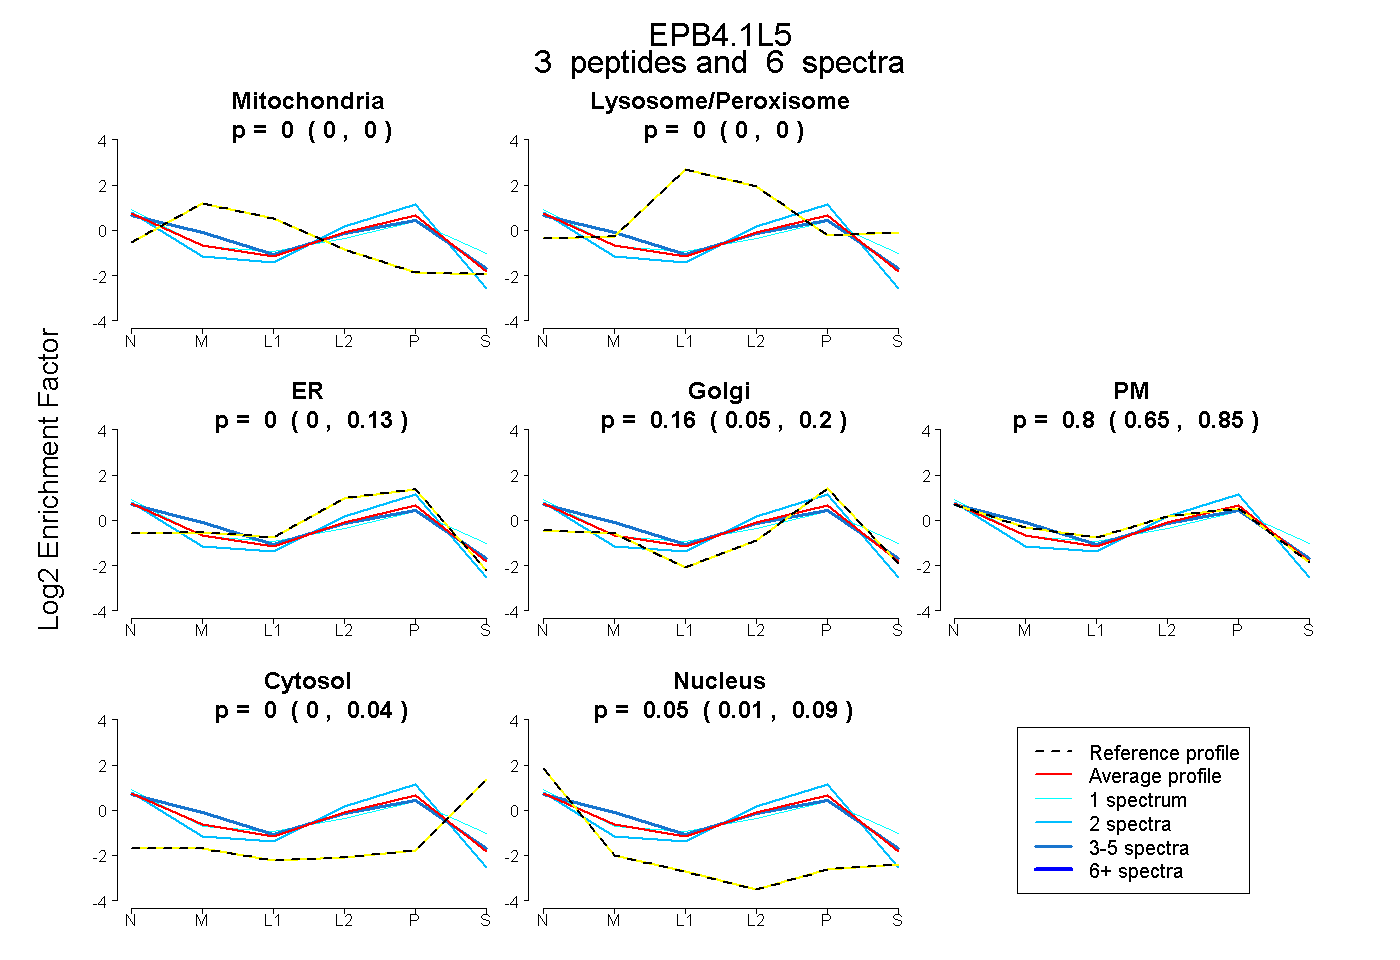
0.000 | 0.000
0.000 | 0.000
0.000 | 0.129
0.054 | 0.201
0.648 | 0.845
0.000 | 0.039
0.007 | 0.093