 13
13peptides
spectra
0.000 | 0.000
0.000 | 0.000
0.084 | 0.102
0.087 | 0.122
0.000 | 0.000
0.678 | 0.717
0.094 | 0.108
0.000 | 0.000
| Plot | Mito | Lyso | Perox | ER | Golgi | PM | Cytosol | Nucleus | |||||
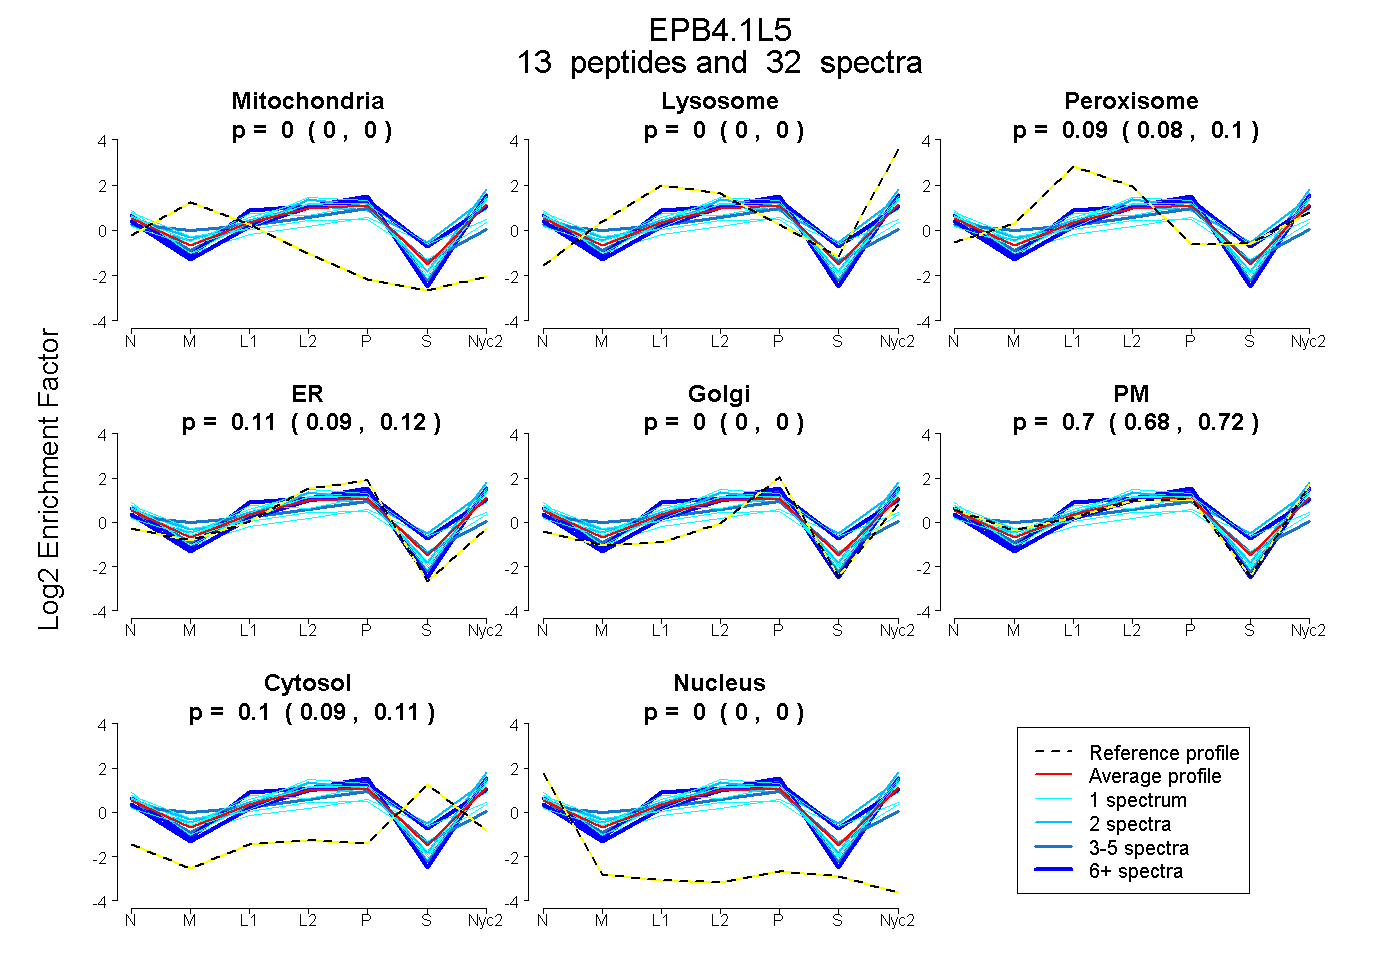
| Expt A |
13 peptides |
32 spectra |
|
0.000 0.000 | 0.000 |
0.000 0.000 | 0.000 |
0.094 0.084 | 0.102 |
0.106 0.087 | 0.122 |
0.000 0.000 | 0.000 |
0.699 0.678 | 0.717 |
0.101 0.094 | 0.108 |
0.000 0.000 | 0.000 |
| 3 spectra, AATHIPAAGDAK | 0.000 | 0.000 | 0.000 | 0.103 | 0.000 | 0.884 | 0.012 | 0.000 | ||
| 1 spectrum, YLFVLQLK | 0.000 | 0.000 | 0.028 | 0.045 | 0.000 | 0.869 | 0.058 | 0.000 | ||
| 1 spectrum, WLEMYGVDMHVVK | 0.000 | 0.000 | 0.091 | 0.193 | 0.000 | 0.716 | 0.000 | 0.000 | ||
| 1 spectrum, VSLLDGTDVSVDLPK | 0.000 | 0.000 | 0.034 | 0.043 | 0.000 | 0.861 | 0.061 | 0.000 | ||
| 1 spectrum, QDILSGK | 0.034 | 0.000 | 0.151 | 0.054 | 0.000 | 0.568 | 0.109 | 0.085 | ||
| 2 spectra, FYSSEPNNLR | 0.000 | 0.055 | 0.031 | 0.000 | 0.000 | 0.890 | 0.024 | 0.000 | ||
| 6 spectra, ALPPPQTAYR | 0.000 | 0.000 | 0.033 | 0.151 | 0.000 | 0.816 | 0.000 | 0.000 | ||
| 4 spectra, IGSPYCLHLR | 0.122 | 0.000 | 0.160 | 0.248 | 0.154 | 0.233 | 0.083 | 0.000 | ||
| 2 spectra, AAMTDI | 0.000 | 0.115 | 0.169 | 0.000 | 0.000 | 0.548 | 0.168 | 0.000 | ||
| 1 spectrum, DGNDYSLGLTPTGVLVFEGETK | 0.000 | 0.000 | 0.017 | 0.000 | 0.000 | 0.668 | 0.316 | 0.000 | ||
| 1 spectrum, FMDSAQVAHWLDGTK | 0.000 | 0.000 | 0.105 | 0.132 | 0.000 | 0.763 | 0.000 | 0.000 | ||
| 8 spectra, LSATSDR | 0.000 | 0.029 | 0.059 | 0.171 | 0.000 | 0.535 | 0.206 | 0.000 | ||
| 1 spectrum, NAGAHHDAHLAGR | 0.000 | 0.000 | 0.374 | 0.073 | 0.345 | 0.087 | 0.121 | 0.000 |
| Plot | Mito | Lyso or Perox | ER | Golgi | PM | Cytosol | Nucleus | ||||||
| Expt B |
3 peptides |
6 spectra |
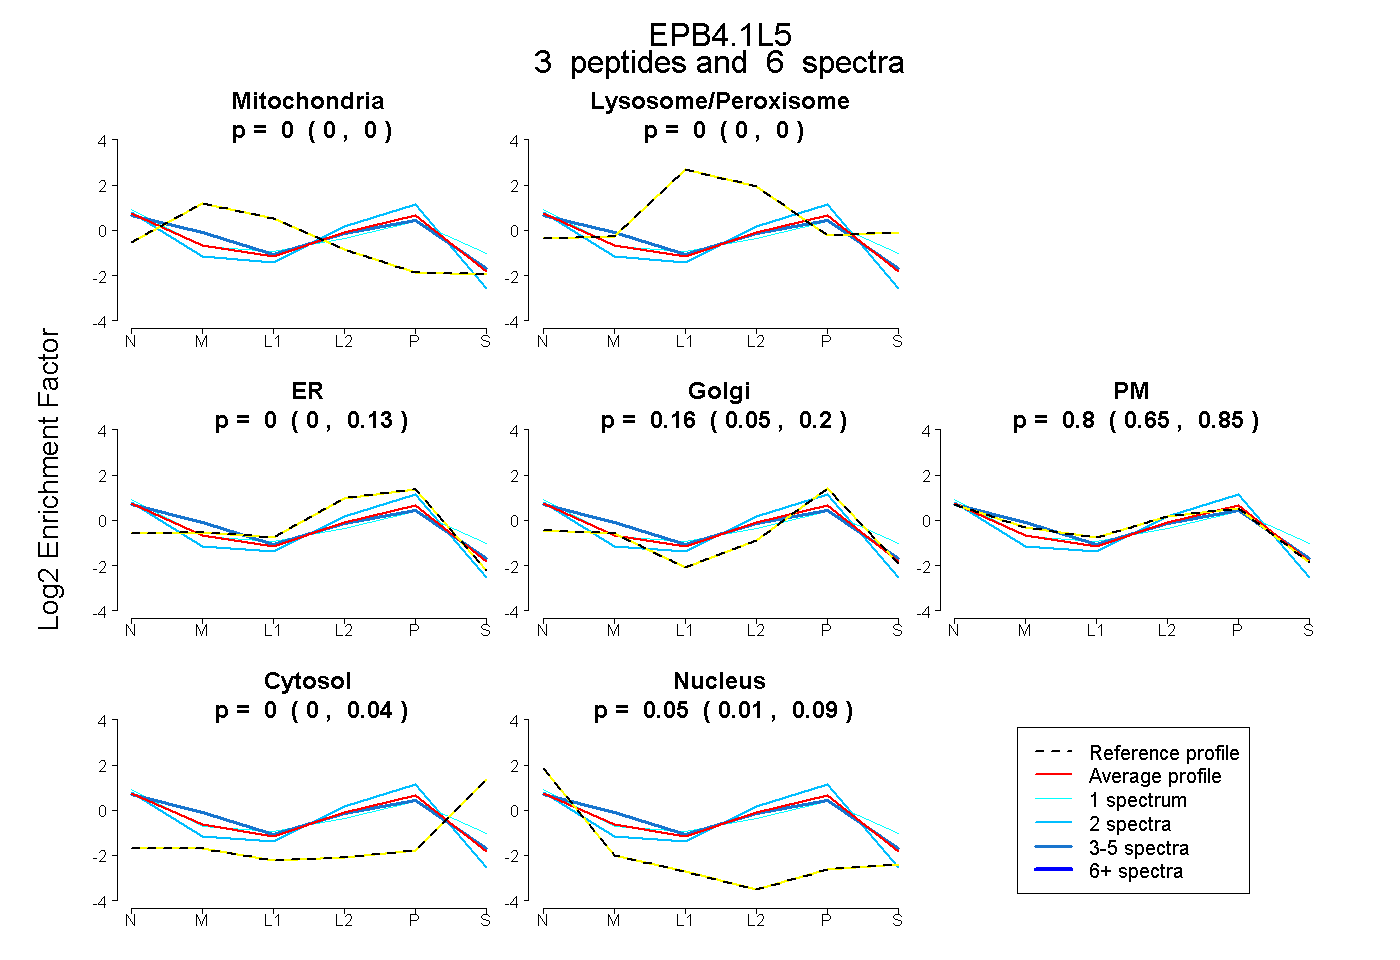 |
0.000 0.000 | 0.000 |
0.000 0.000 | 0.000 |
0.000 0.000 | 0.129 |
0.157 0.054 | 0.201 |
0.798 0.648 | 0.845 |
0.000 0.000 | 0.039 |
0.045 0.007 | 0.093 |
|||
| Plot | Lyso | Other | |||||||||||
| Expt C |
13 peptides |
54 spectra |
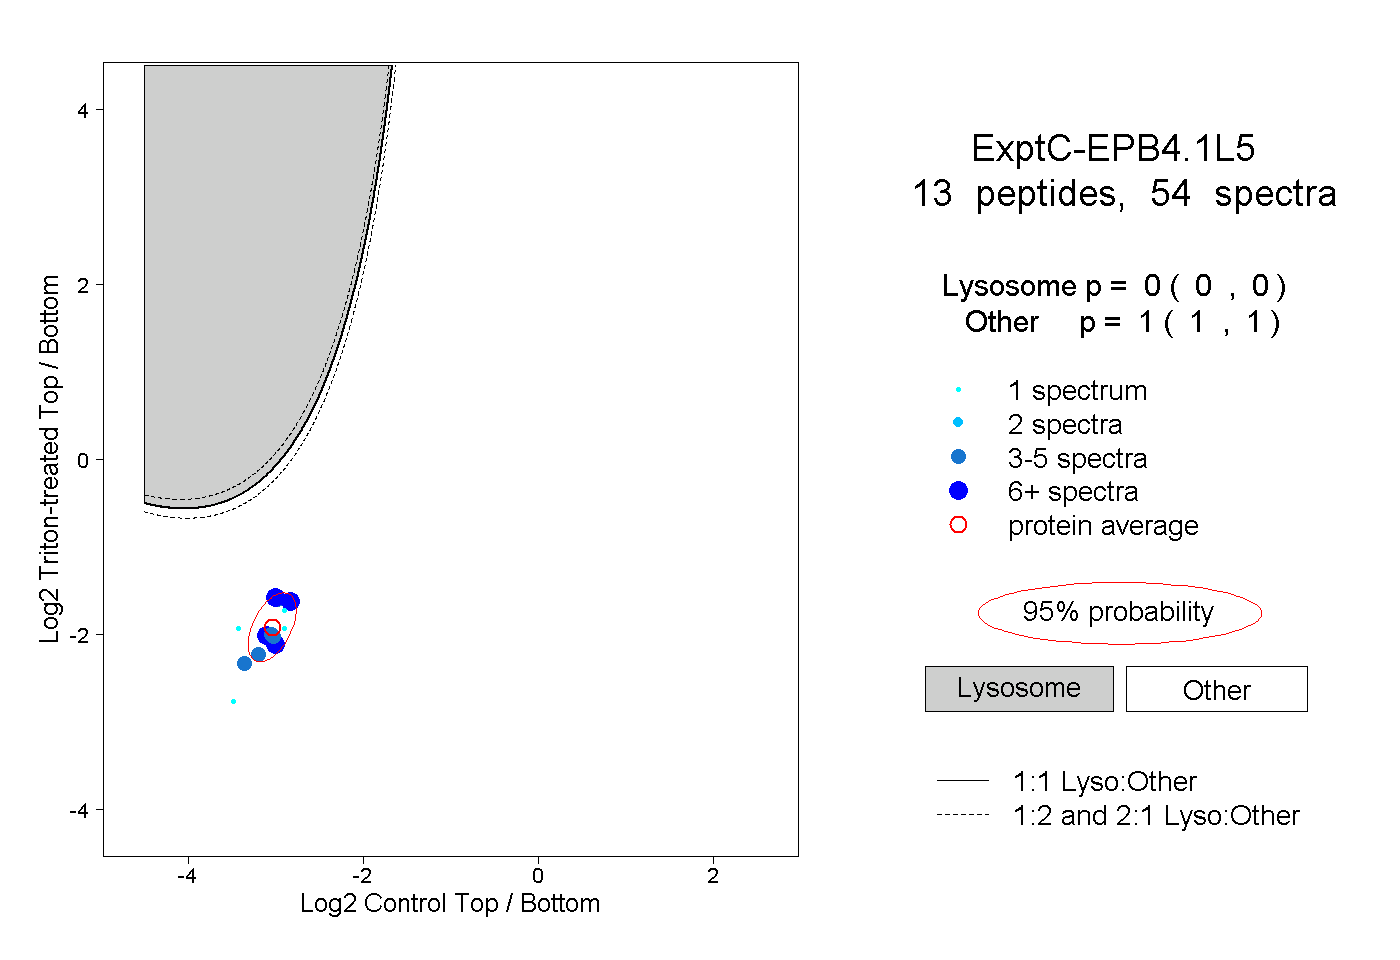 |
0.000 0.000 | 0.000 |
1.000 1.000 | 1.000 |