 2
2peptides
spectra
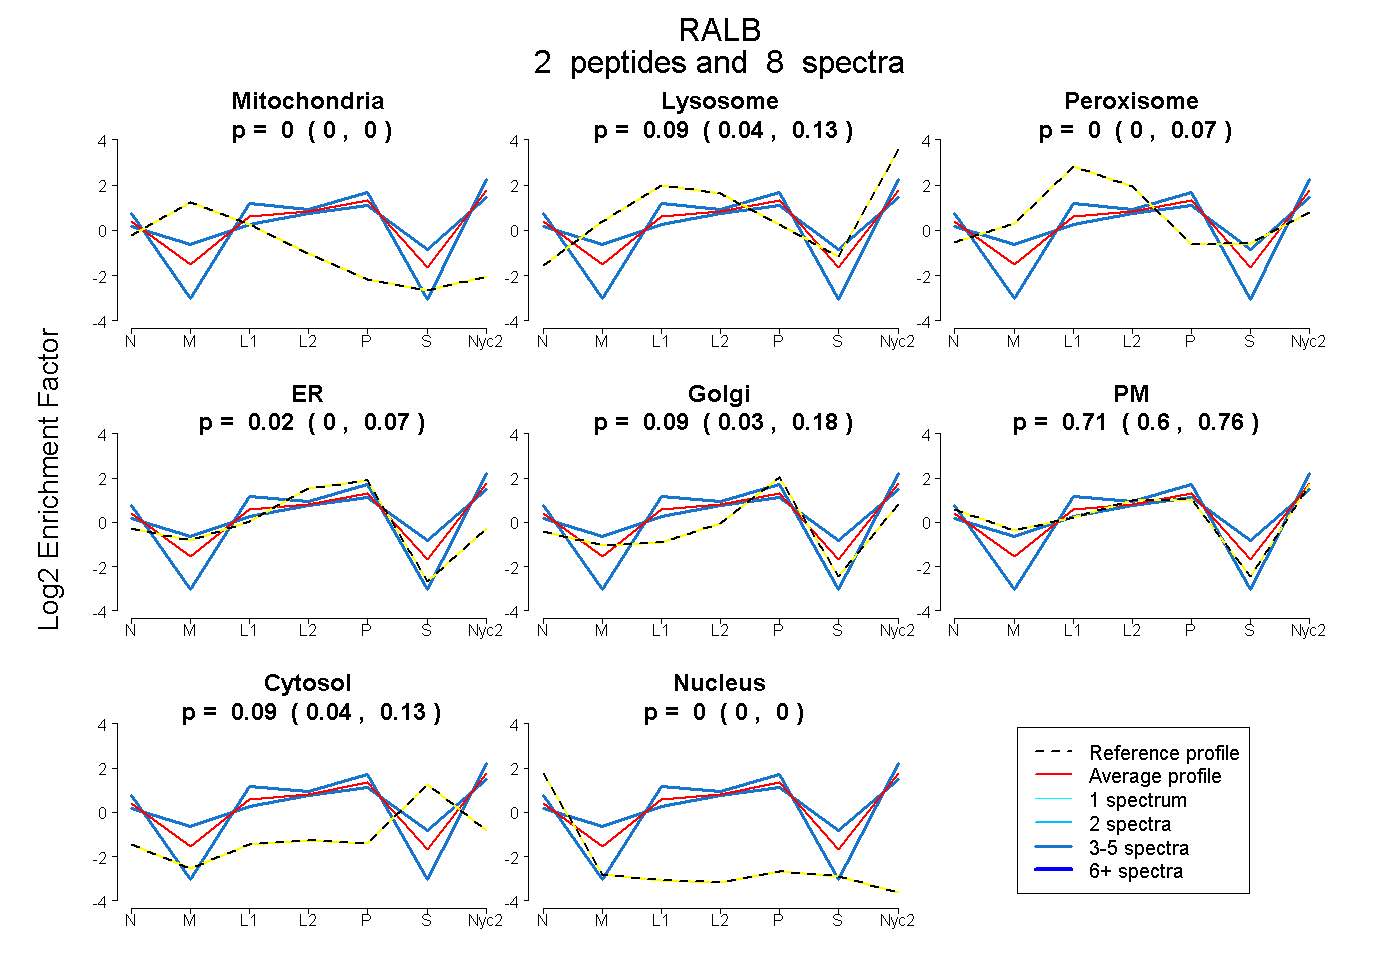
0.000 | 0.000
0.035 | 0.125
0.000 | 0.066
0.000 | 0.066
0.028 | 0.175
0.604 | 0.757
0.037 | 0.130
0.000 | 0.000
1peptide
spectra
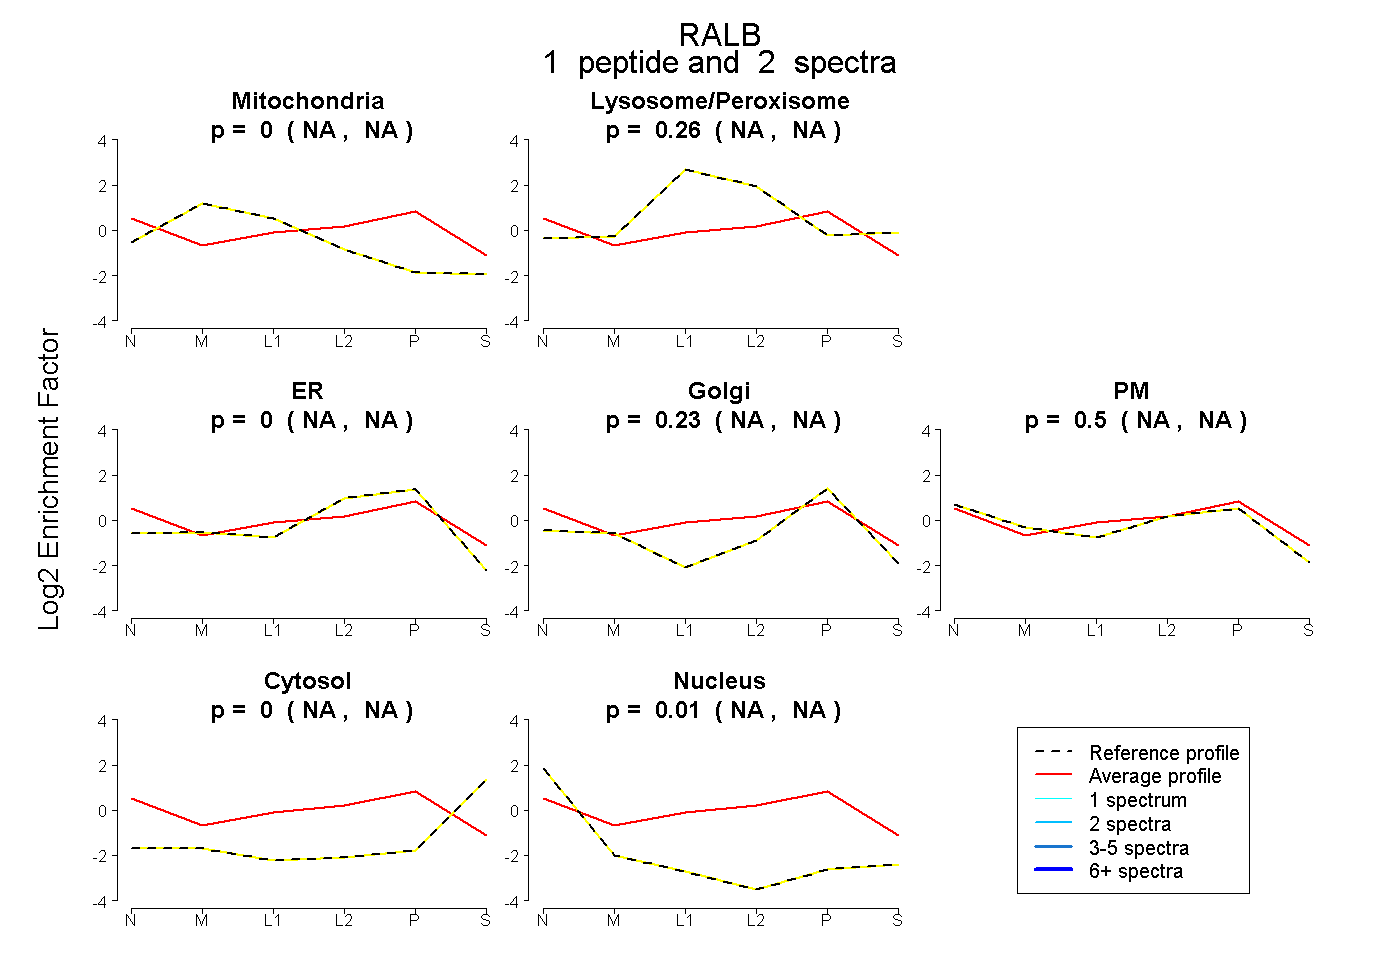
NA | NA
NA | NA
NA | NA
NA | NA
NA | NA
NA | NA
NA | NA
3peptides
spectra
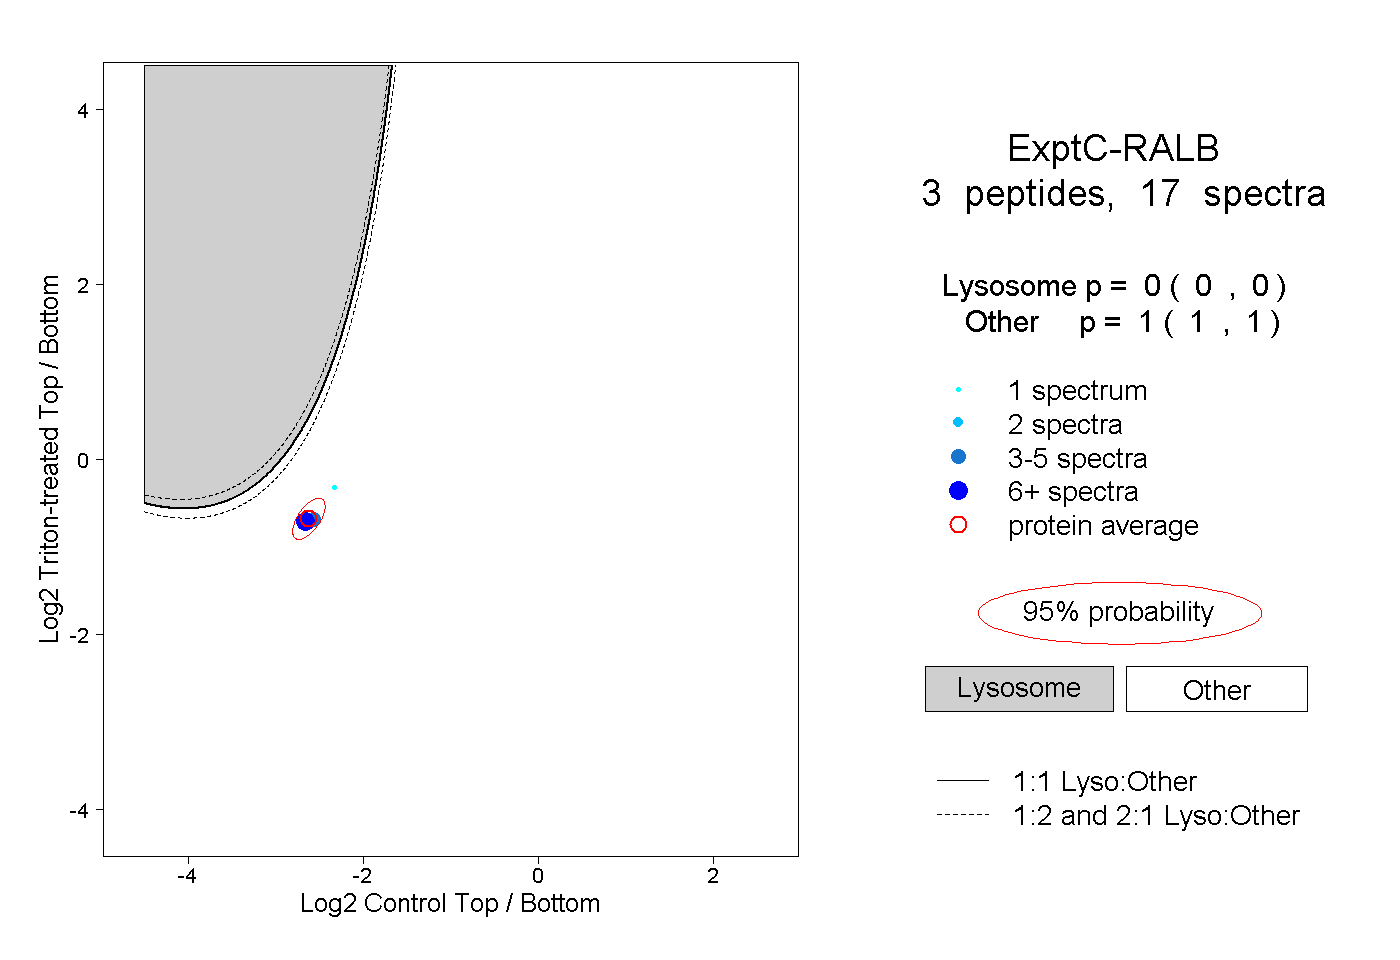
0.000 | 0.000
1.000 | 1.000