 3
3peptides
spectra
0.000 | 0.059
0.000 | 0.079
0.000 | 0.136
0.000 | 0.000
0.000 | 0.000
0.164 | 0.306
0.578 | 0.721
0.000 | 0.008
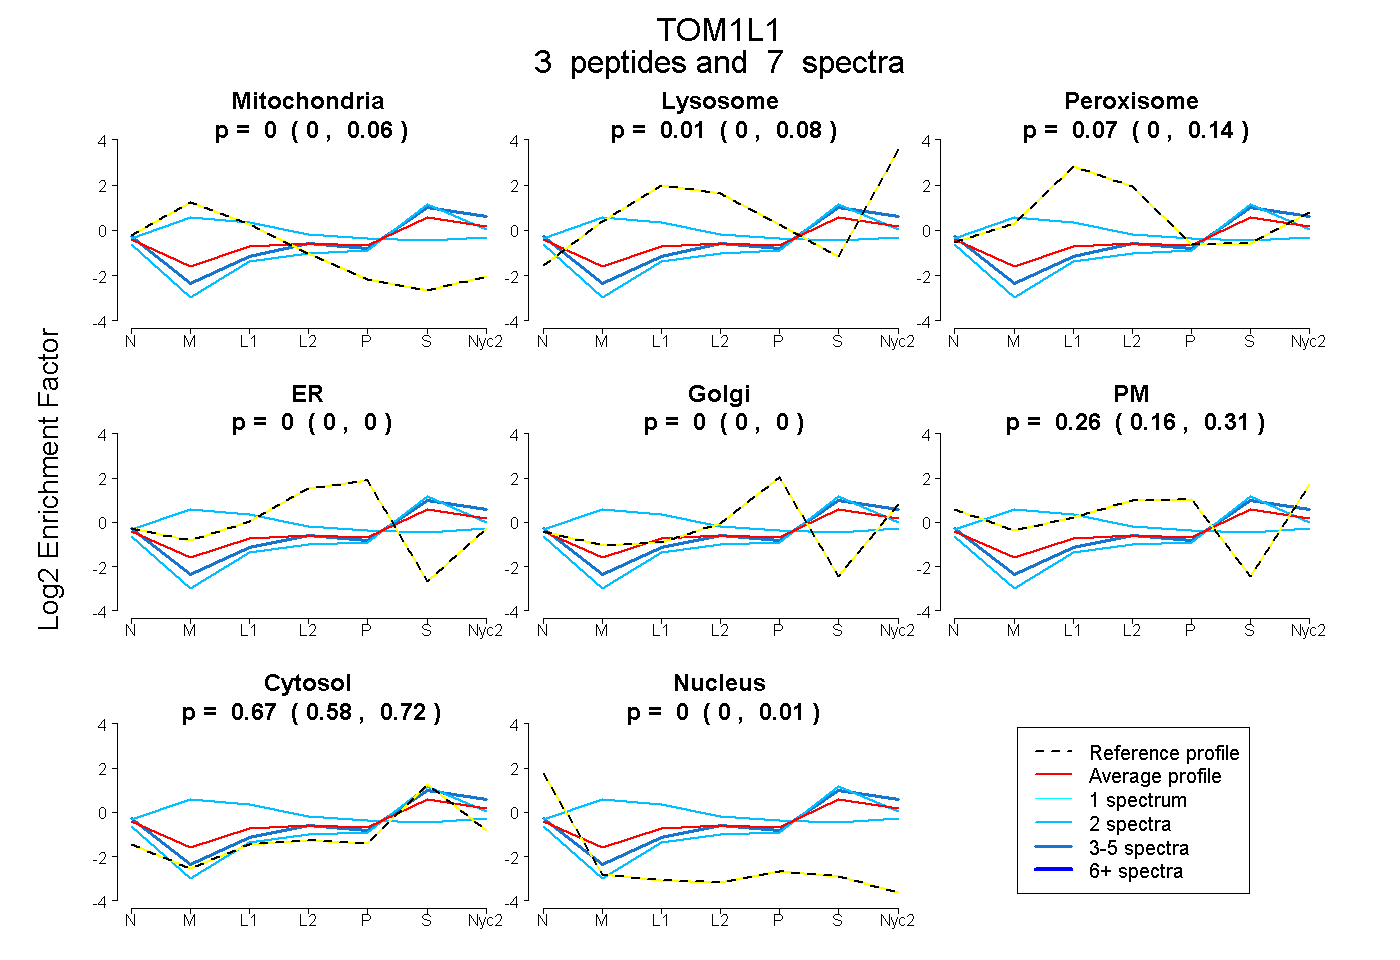
| Plot | Mito | Lyso | Perox | ER | Golgi | PM | Cytosol | Nucleus | |||||
| Expt A |
3 peptides |
7 spectra |
|
0.000 0.000 | 0.059 |
0.005 0.000 | 0.079 |
0.068 0.000 | 0.136 |
0.000 0.000 | 0.000 |
0.000 0.000 | 0.000 |
0.258 0.164 | 0.306 |
0.669 0.578 | 0.721 |
0.000 0.000 | 0.008 |
| 2 spectra, YTLPLETQNR | 0.000 | 0.000 | 0.000 | 0.000 | 0.000 | 0.118 | 0.882 | 0.000 | ||
| 3 spectra, ILSFIK | 0.000 | 0.039 | 0.000 | 0.000 | 0.000 | 0.214 | 0.747 | 0.000 | ||
| 2 spectra, NPTISLVPEQIGK | 0.295 | 0.027 | 0.304 | 0.000 | 0.169 | 0.000 | 0.204 | 0.000 |
| Plot | Lyso | Other | |||||||||||
| Expt C |
1 peptide |
1 spectrum |
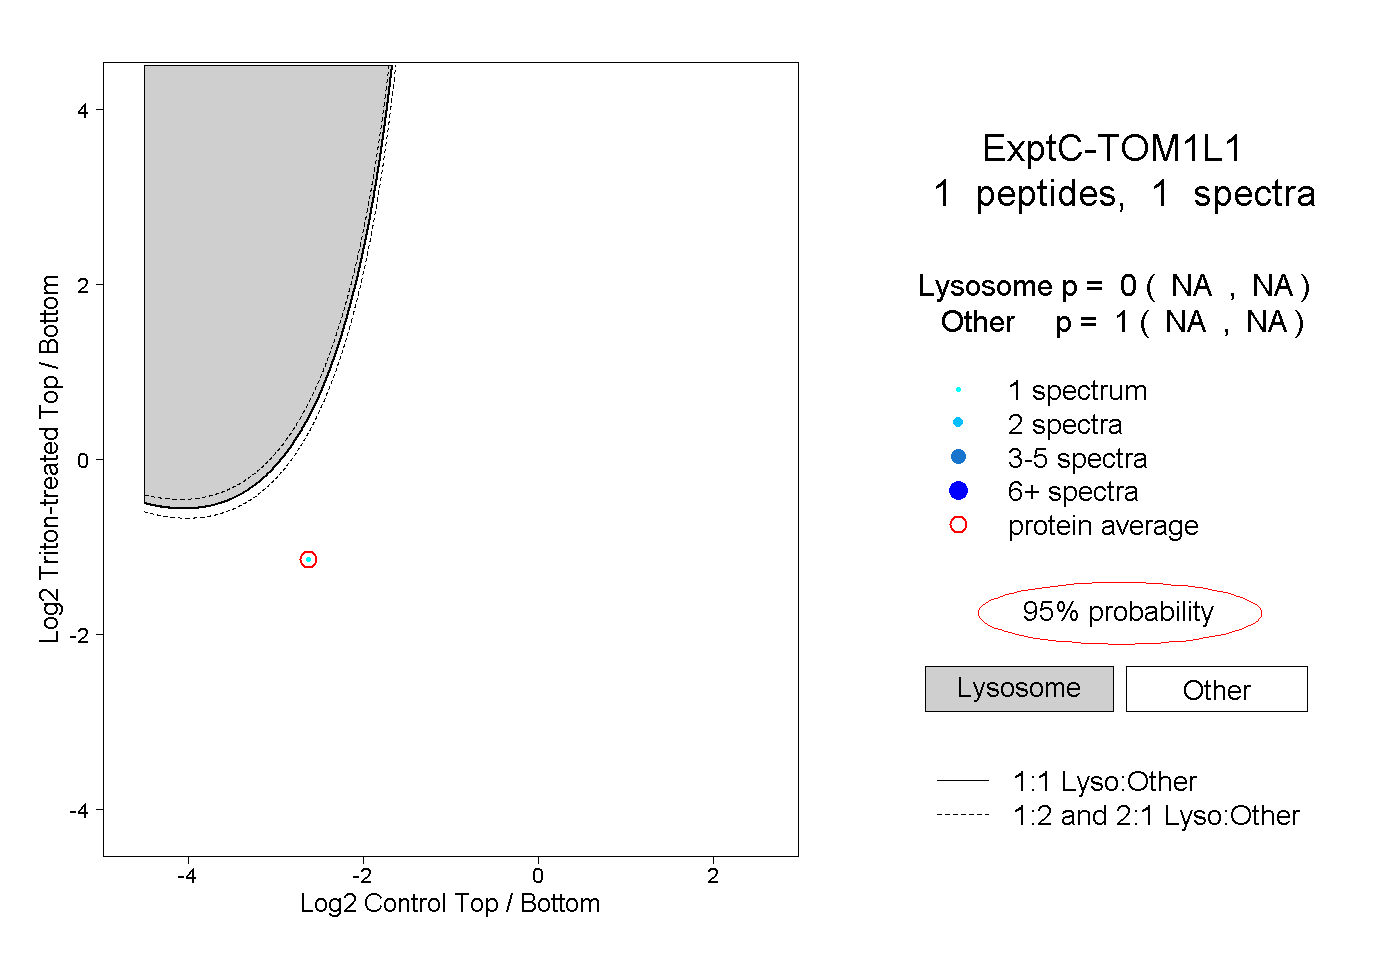 |
0.000 NA | NA |
1.000 NA | NA |