 12
12peptides
spectra
0.000 | 0.000
0.054 | 0.064
0.000 | 0.000
0.000 | 0.000
0.000 | 0.000
0.000 | 0.000
0.935 | 0.945
0.000 | 0.000
| Plot | Mito | Lyso | Perox | ER | Golgi | PM | Cytosol | Nucleus | |||||
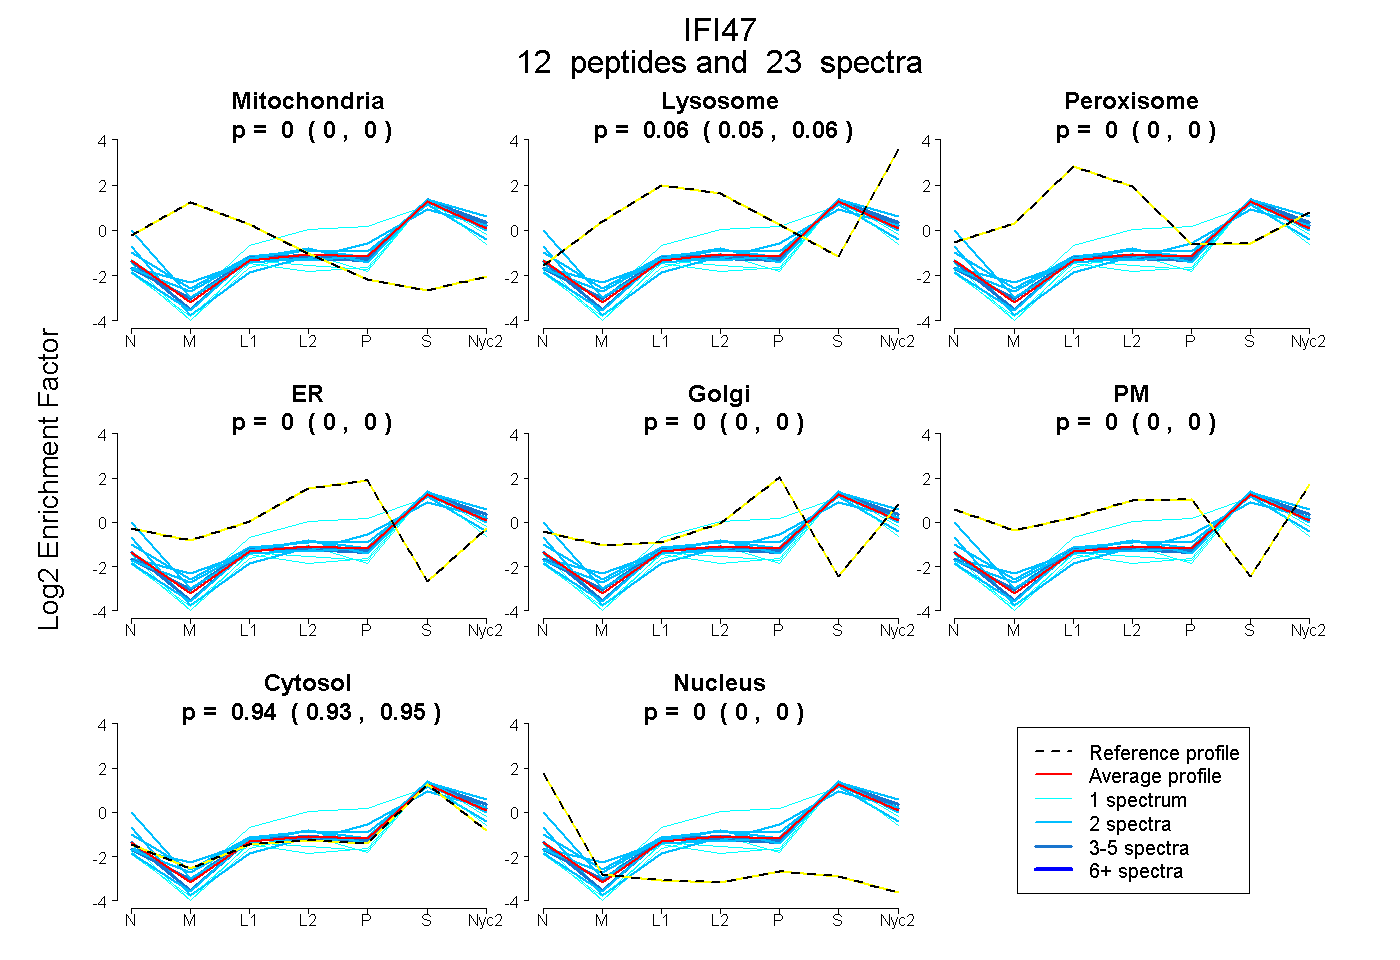
| Expt A |
12 peptides |
23 spectra |
|
0.000 0.000 | 0.000 |
0.060 0.054 | 0.064 |
0.000 0.000 | 0.000 |
0.000 0.000 | 0.000 |
0.000 0.000 | 0.000 |
0.000 0.000 | 0.000 |
0.940 0.935 | 0.945 |
0.000 0.000 | 0.000 |
| 1 spectrum, SGGMLSPETLSAIHYALQEGR | 0.000 | 0.000 | 0.000 | 0.000 | 0.000 | 0.000 | 1.000 | 0.000 | ||
| 2 spectra, VDSDLYSEER | 0.000 | 0.000 | 0.000 | 0.000 | 0.005 | 0.179 | 0.787 | 0.030 | ||
| 2 spectra, HFLQEK | 0.000 | 0.124 | 0.000 | 0.000 | 0.000 | 0.000 | 0.876 | 0.000 | ||
| 2 spectra, TPYQHPK | 0.000 | 0.027 | 0.000 | 0.000 | 0.000 | 0.000 | 0.973 | 0.000 | ||
| 4 spectra, SYFGLDDK | 0.000 | 0.066 | 0.000 | 0.000 | 0.000 | 0.000 | 0.934 | 0.000 | ||
| 1 spectrum, FSVNDALLAQK | 0.000 | 0.146 | 0.000 | 0.105 | 0.027 | 0.000 | 0.722 | 0.000 | ||
| 1 spectrum, GGLGSSVVQALK | 0.000 | 0.000 | 0.000 | 0.000 | 0.000 | 0.000 | 1.000 | 0.000 | ||
| 3 spectra, LETPLEDIK | 0.000 | 0.067 | 0.000 | 0.000 | 0.000 | 0.000 | 0.933 | 0.000 | ||
| 1 spectrum, ELPGHK | 0.000 | 0.000 | 0.000 | 0.000 | 0.000 | 0.000 | 1.000 | 0.000 | ||
| 2 spectra, TQFLNVVVEDAK | 0.000 | 0.133 | 0.000 | 0.000 | 0.000 | 0.000 | 0.867 | 0.000 | ||
| 2 spectra, ICLEALK | 0.000 | 0.005 | 0.006 | 0.000 | 0.000 | 0.101 | 0.888 | 0.000 | ||
| 2 spectra, LEETLLK | 0.000 | 0.000 | 0.000 | 0.000 | 0.000 | 0.026 | 0.964 | 0.010 |
| Plot | Mito | Lyso or Perox | ER | Golgi | PM | Cytosol | Nucleus | ||||||
| Expt B |
2 peptides |
2 spectra |
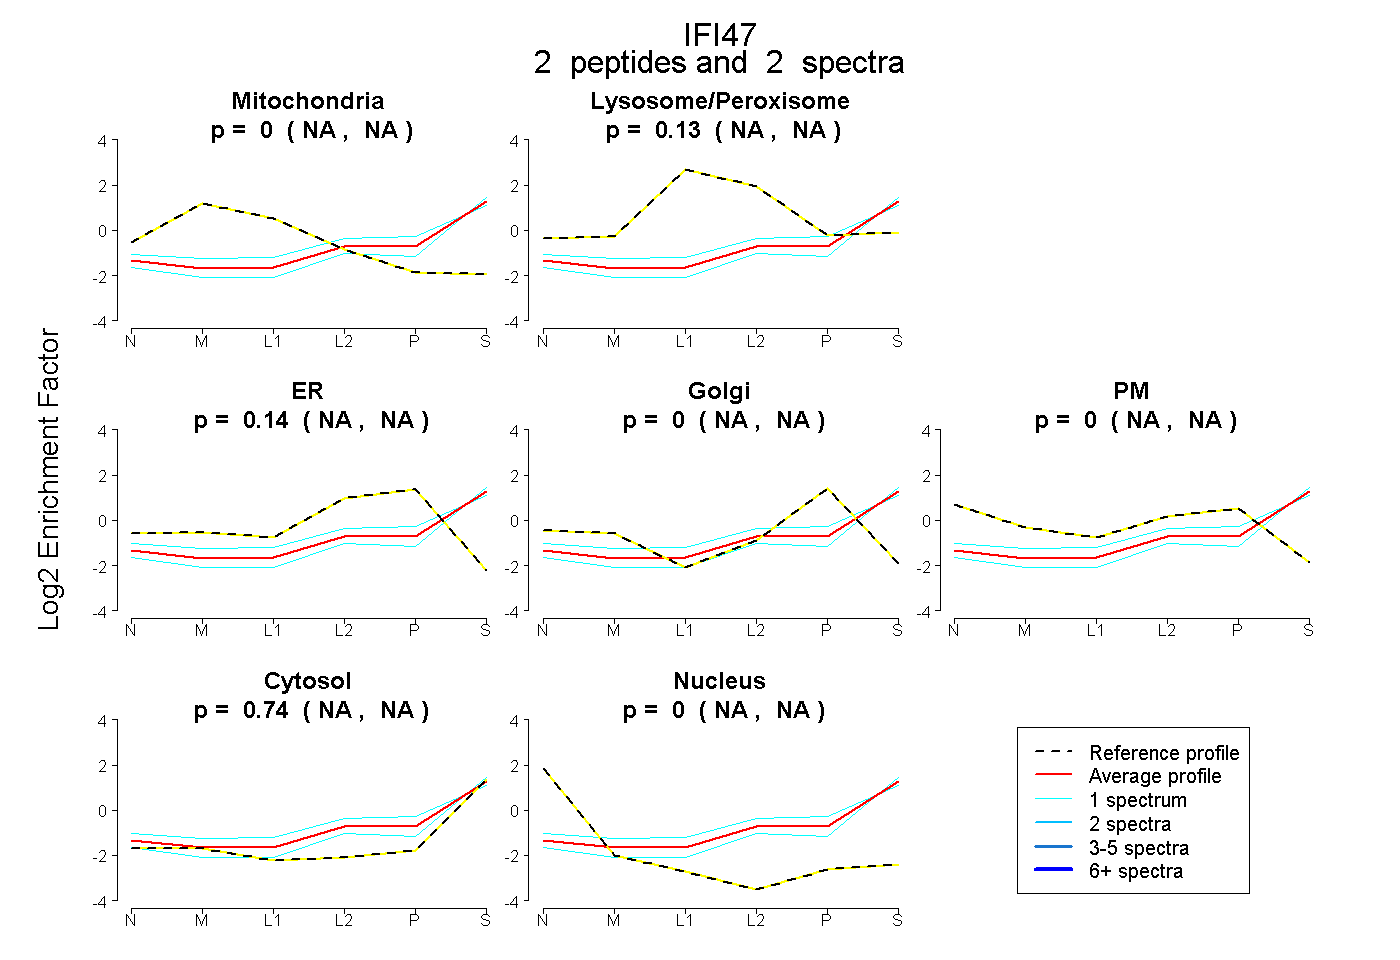 |
0.000 NA | NA |
0.126 NA | NA |
0.136 NA | NA |
0.000 NA | NA |
0.000 NA | NA |
0.738 NA | NA |
0.000 NA | NA |
|||
| Plot | Lyso | Other | |||||||||||
| Expt C |
9 peptides |
16 spectra |
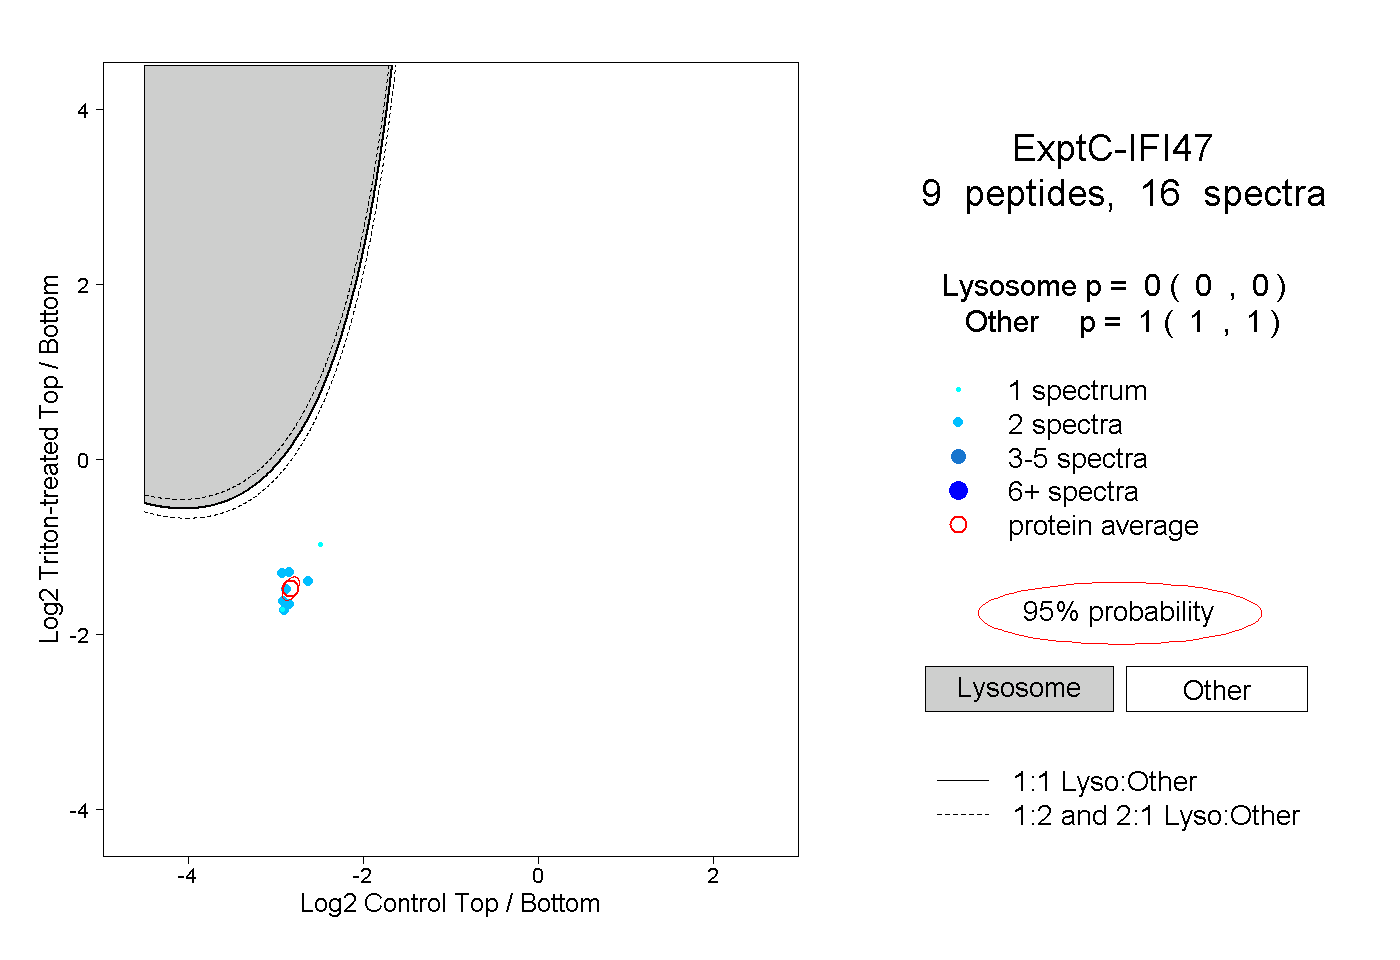 |
0.000 0.000 | 0.000 |
1.000 1.000 | 1.000 |
||||||||
| Plot | Lyso | Other | |||||||||||
| Expt D |
2 peptides |
2 spectra |
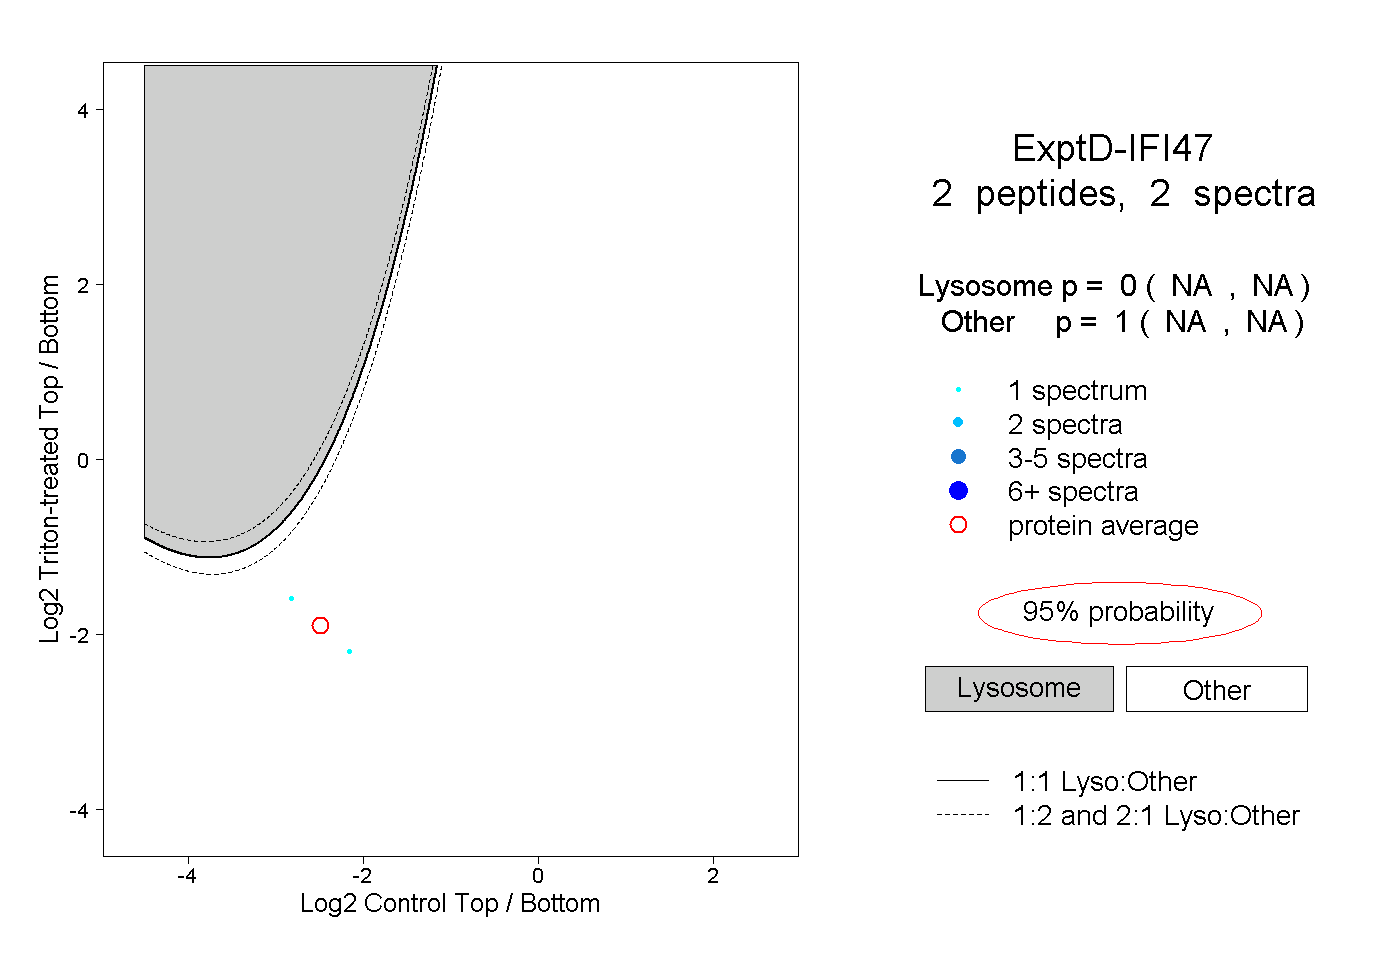 |
0.000 NA | NA |
1.000 NA | NA |