 3
3peptides
spectra
0.000 | 0.000
0.000 | 0.000
0.000 | 0.000
0.000 | 0.267
0.000 | 0.253
0.000 | 0.000
0.142 | 0.335
0.442 | 0.647
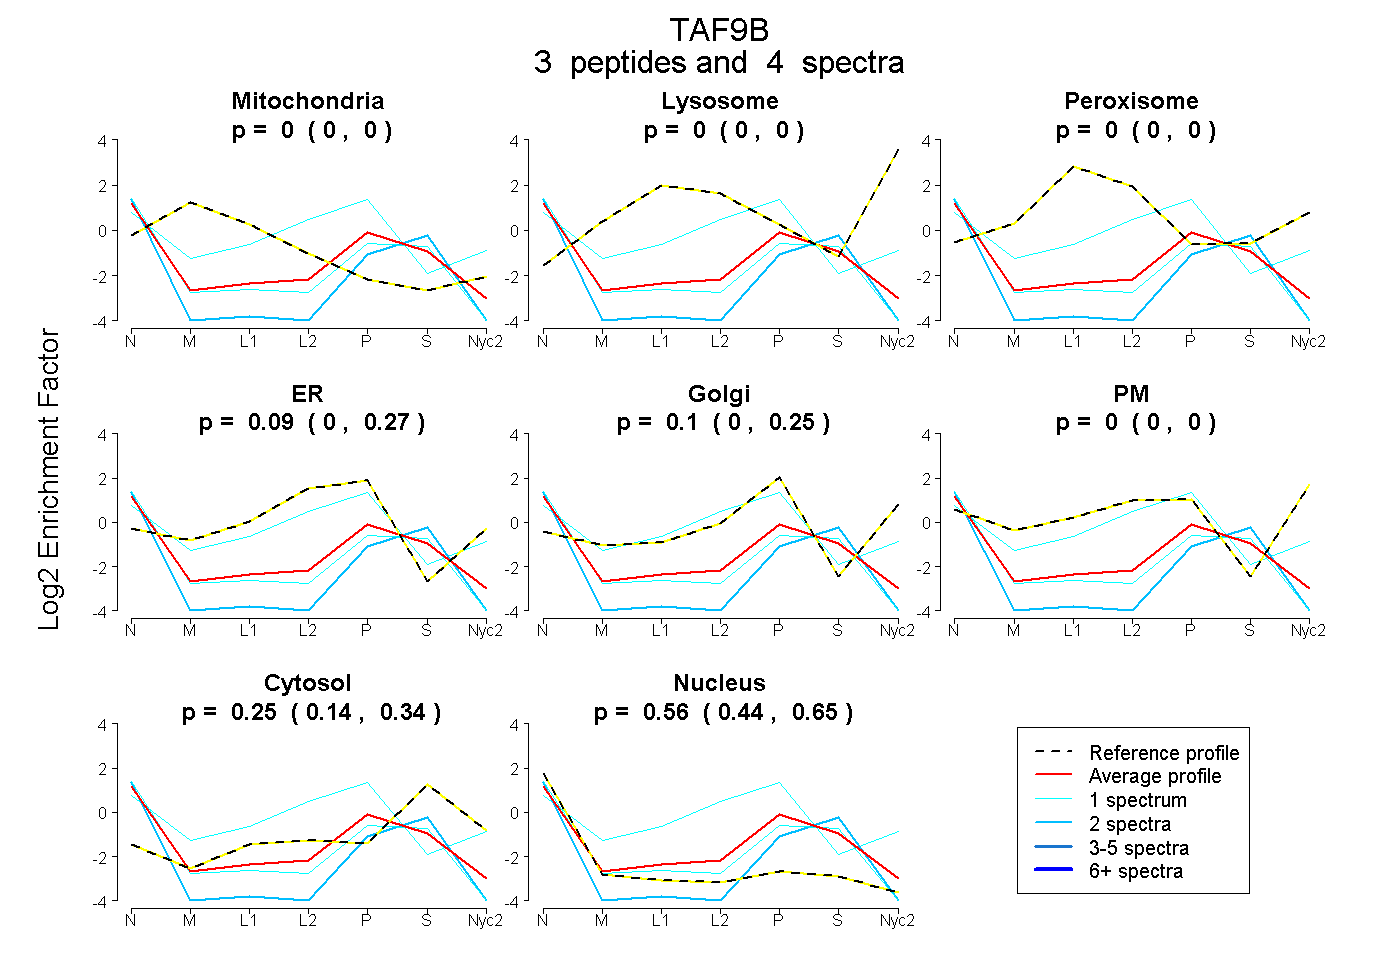
| Plot | Mito | Lyso | Perox | ER | Golgi | PM | Cytosol | Nucleus | |||||
| Expt A |
3 peptides |
4 spectra |
|
0.000 0.000 | 0.000 |
0.000 0.000 | 0.000 |
0.000 0.000 | 0.000 |
0.090 0.000 | 0.267 |
0.104 0.000 | 0.253 |
0.000 0.000 | 0.000 |
0.251 0.142 | 0.335 |
0.555 0.442 | 0.647 |