 18
18peptides
spectra
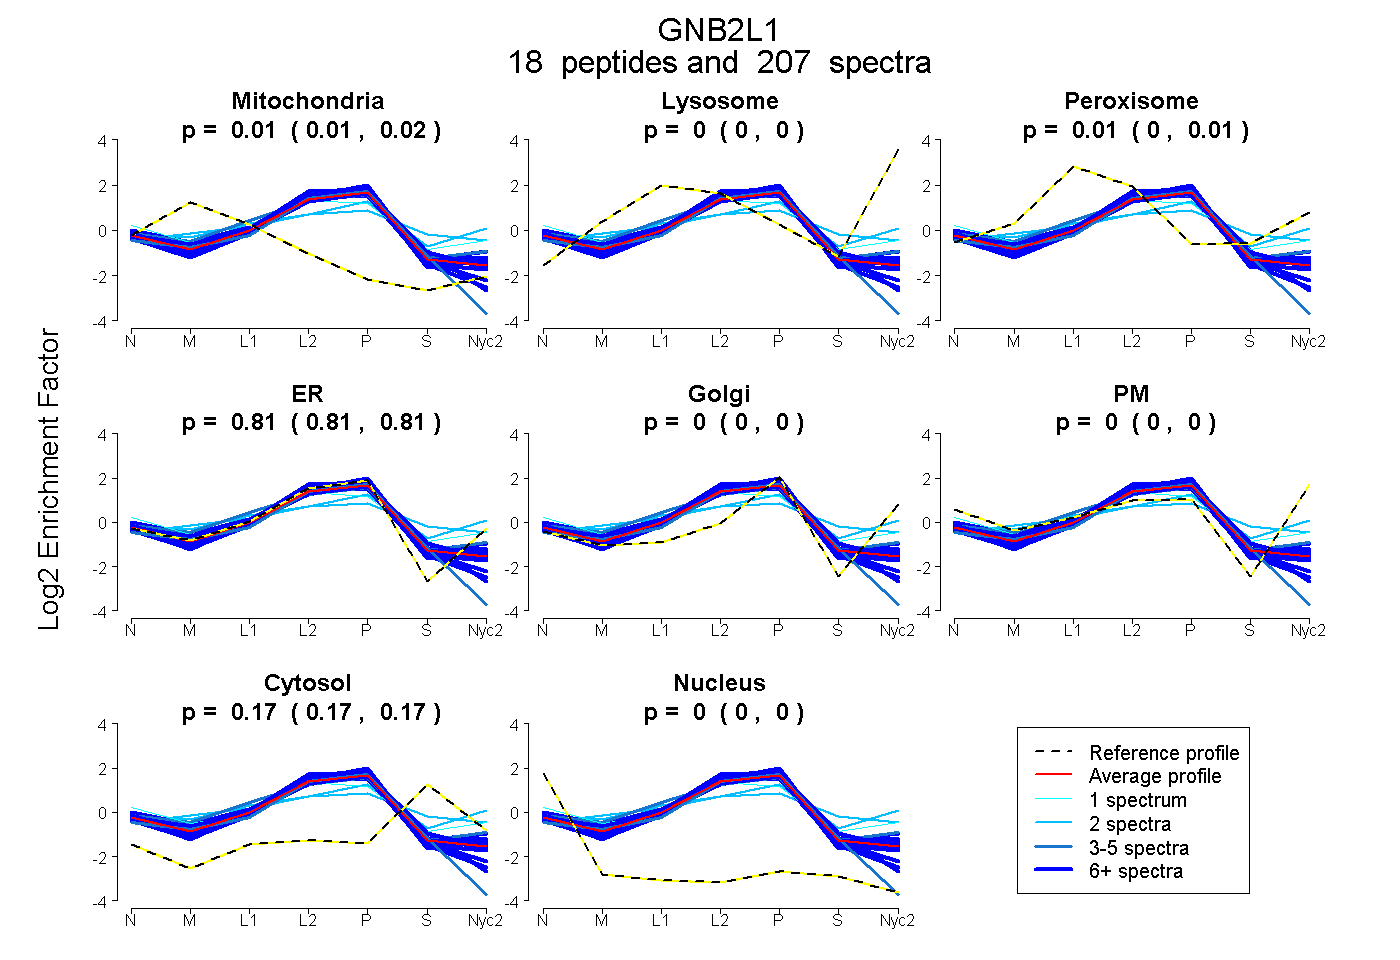
0.010 | 0.015
0.000 | 0.000
0.003 | 0.007
0.806 | 0.809
0.000 | 0.000
0.000 | 0.000
0.172 | 0.175
0.000 | 0.000
16peptides
spectra
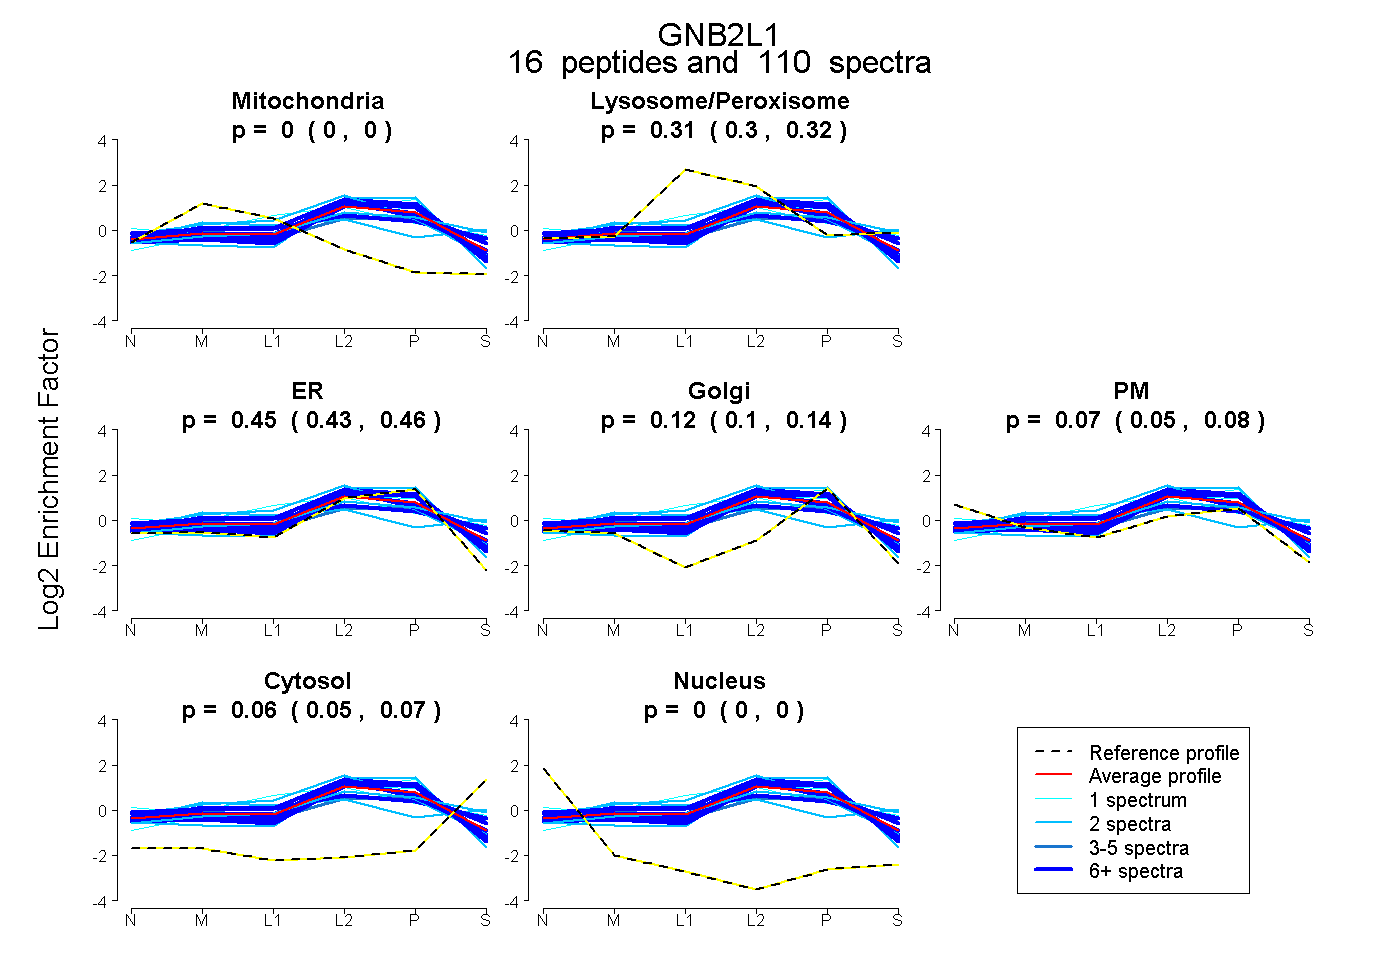
0.000 | 0.000
0.300 | 0.317
0.428 | 0.460
0.096 | 0.138
0.053 | 0.076
0.054 | 0.065
0.000 | 0.000
18peptides
spectra
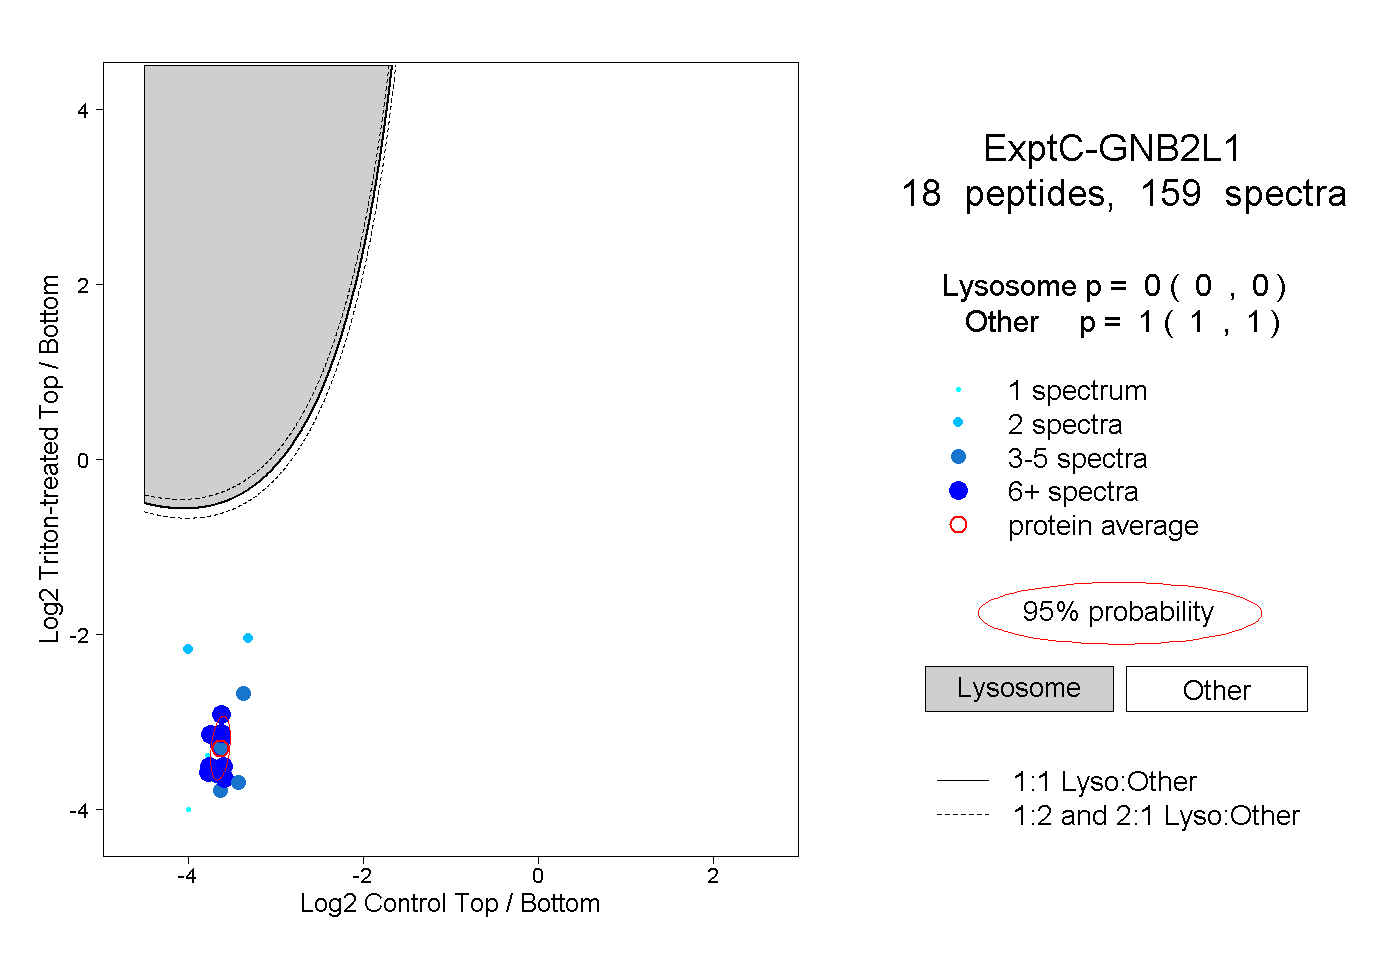
0.000 | 0.000
1.000 | 1.000
8peptides
spectra
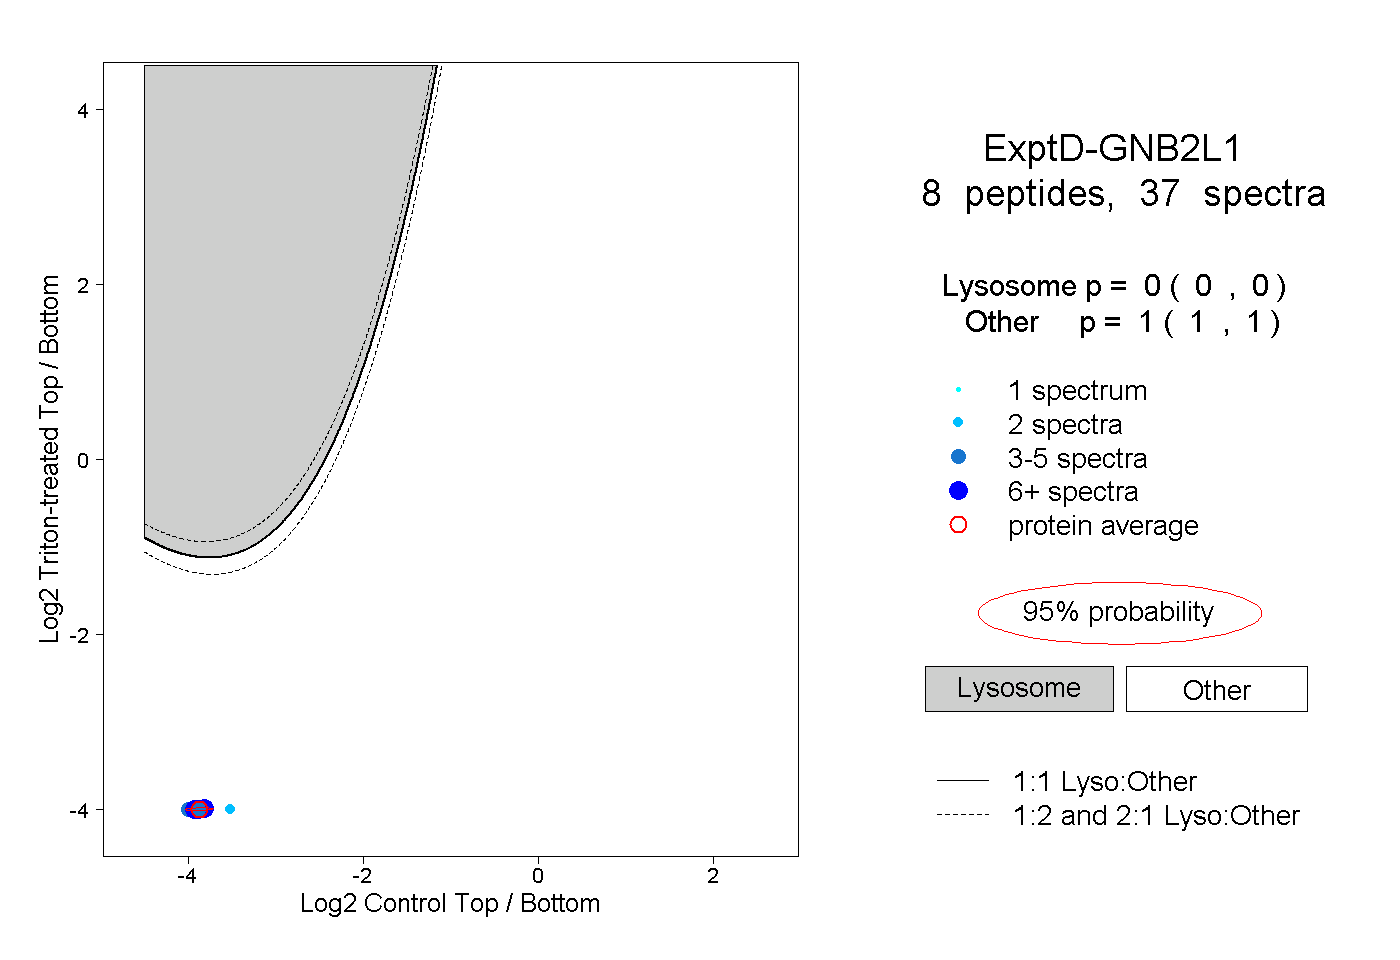
0.000 | 0.000
1.000 | 1.000