 8
8peptides
spectra
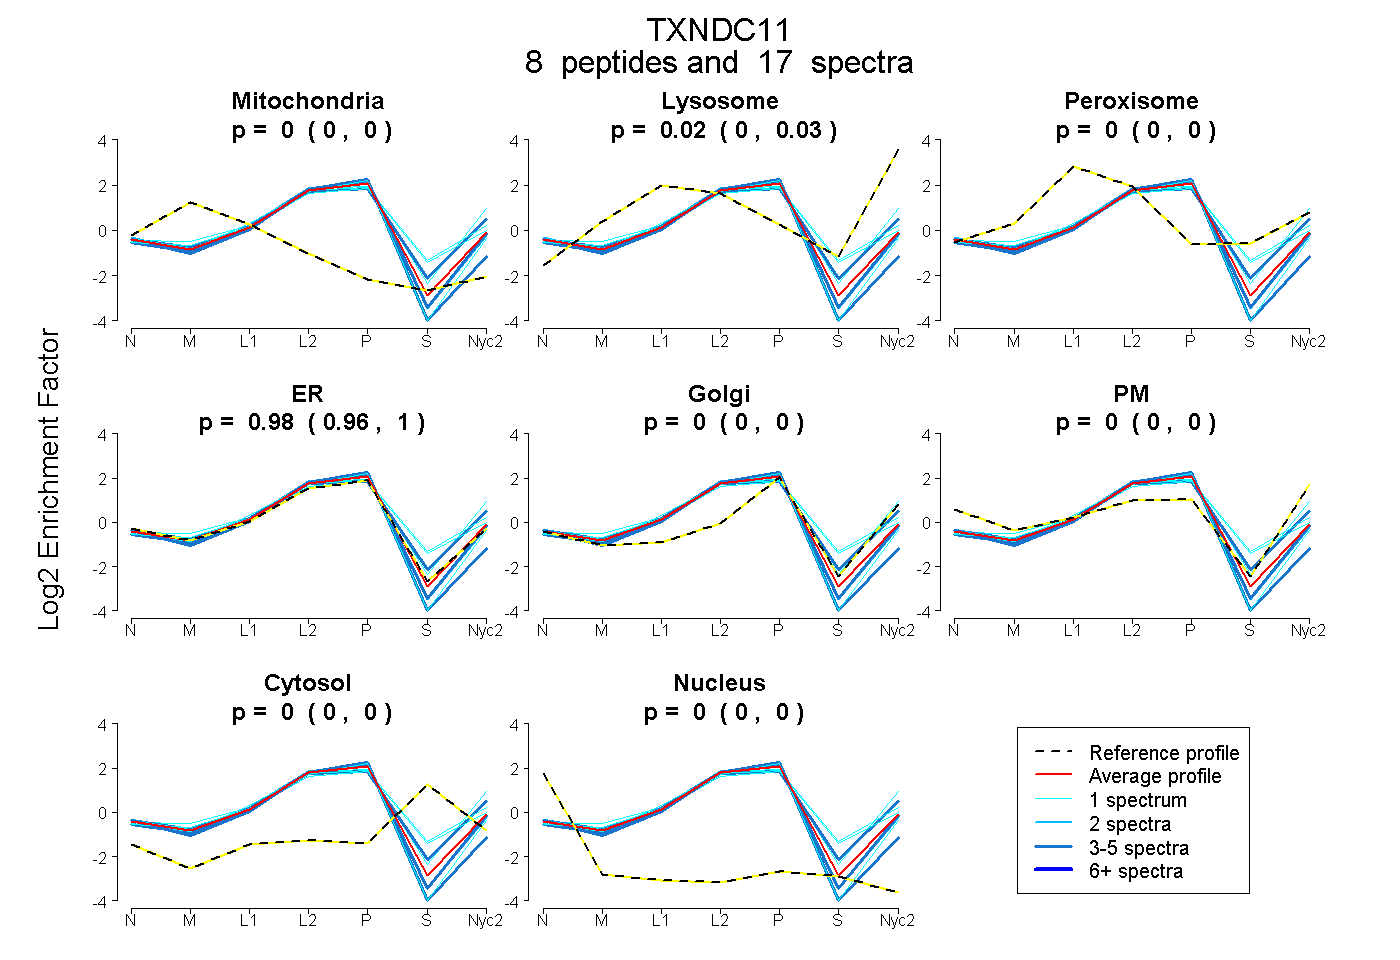
0.000 | 0.000
0.000 | 0.032
0.000 | 0.000
0.964 | 1.000
0.000 | 0.000
0.000 | 0.000
0.000 | 0.000
0.000 | 0.000
| Plot | Mito | Lyso | Perox | ER | Golgi | PM | Cytosol | Nucleus | |||||
| Expt A |
8 peptides |
17 spectra |
|
0.000 0.000 | 0.000 |
0.015 0.000 | 0.032 |
0.000 0.000 | 0.000 |
0.985 0.964 | 1.000 |
0.000 0.000 | 0.000 |
0.000 0.000 | 0.000 |
0.000 0.000 | 0.000 |
0.000 0.000 | 0.000 |
| 1 spectrum, SFGPIEYK | 0.000 | 0.062 | 0.064 | 0.784 | 0.000 | 0.000 | 0.089 | 0.000 | ||
| 1 spectrum, SPVLDLFQGQLDYADHVR | 0.000 | 0.116 | 0.058 | 0.748 | 0.000 | 0.000 | 0.079 | 0.000 | ||
| 4 spectra, LIQHIR | 0.000 | 0.151 | 0.000 | 0.795 | 0.039 | 0.010 | 0.007 | 0.000 | ||
| 1 spectrum, YPGDLPITLPNLLR | 0.000 | 0.000 | 0.000 | 1.000 | 0.000 | 0.000 | 0.000 | 0.000 | ||
| 4 spectra, TQEQVEGR | 0.000 | 0.000 | 0.000 | 1.000 | 0.000 | 0.000 | 0.000 | 0.000 | ||
| 1 spectrum, ELQELASASETPLPEHTWLK | 0.000 | 0.202 | 0.000 | 0.710 | 0.017 | 0.071 | 0.000 | 0.000 | ||
| 2 spectra, LLPEDTFTVAR | 0.000 | 0.000 | 0.000 | 1.000 | 0.000 | 0.000 | 0.000 | 0.000 | ||
| 3 spectra, LPTVLFFPCNR | 0.000 | 0.000 | 0.000 | 1.000 | 0.000 | 0.000 | 0.000 | 0.000 |
| Plot | Mito | Lyso or Perox | ER | Golgi | PM | Cytosol | Nucleus | ||||||
| Expt B |
1 peptide |
2 spectra |
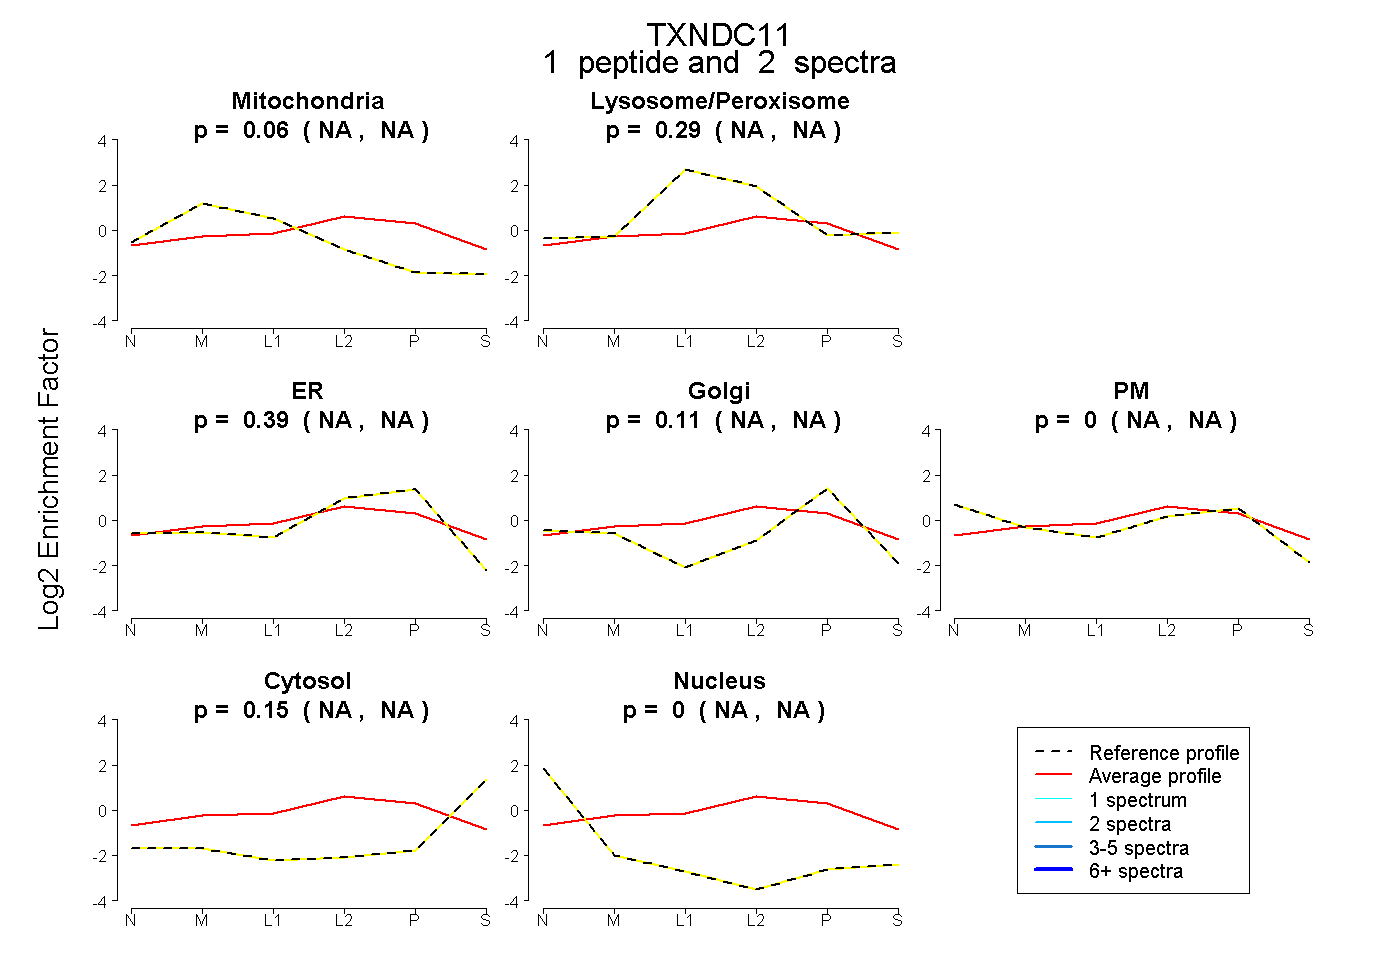 |
0.060 NA | NA |
0.293 NA | NA |
0.394 NA | NA |
0.107 NA | NA |
0.000 NA | NA |
0.145 NA | NA |
0.000 NA | NA |
|||
| Plot | Lyso | Other | |||||||||||
| Expt C |
8 peptides |
26 spectra |
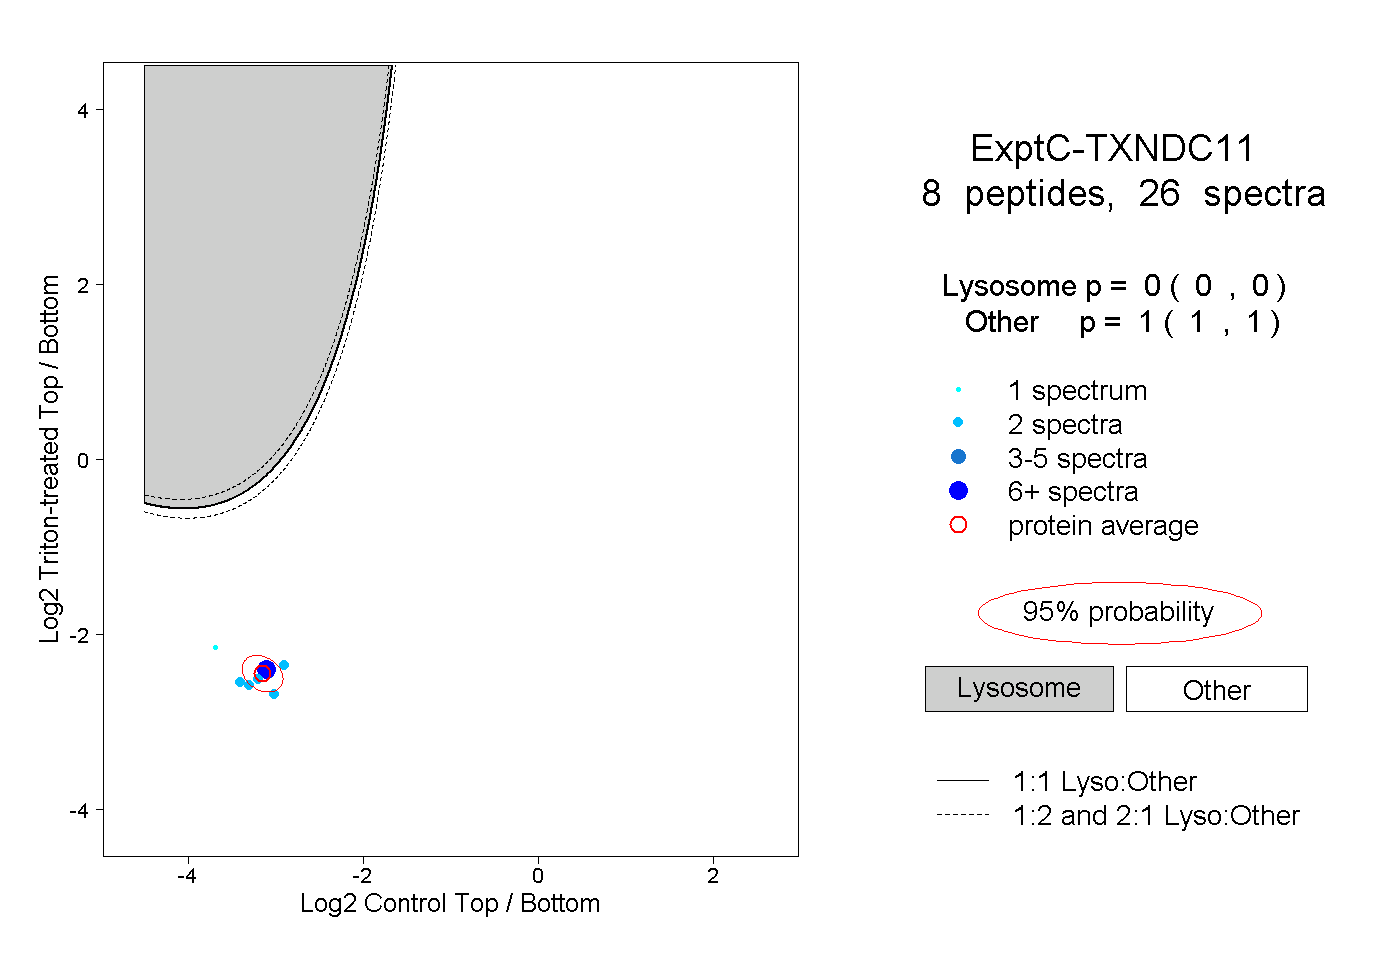 |
0.000 0.000 | 0.000 |
1.000 1.000 | 1.000 |
||||||||
| Plot | Lyso | Other | |||||||||||
| Expt D |
3 peptides |
5 spectra |
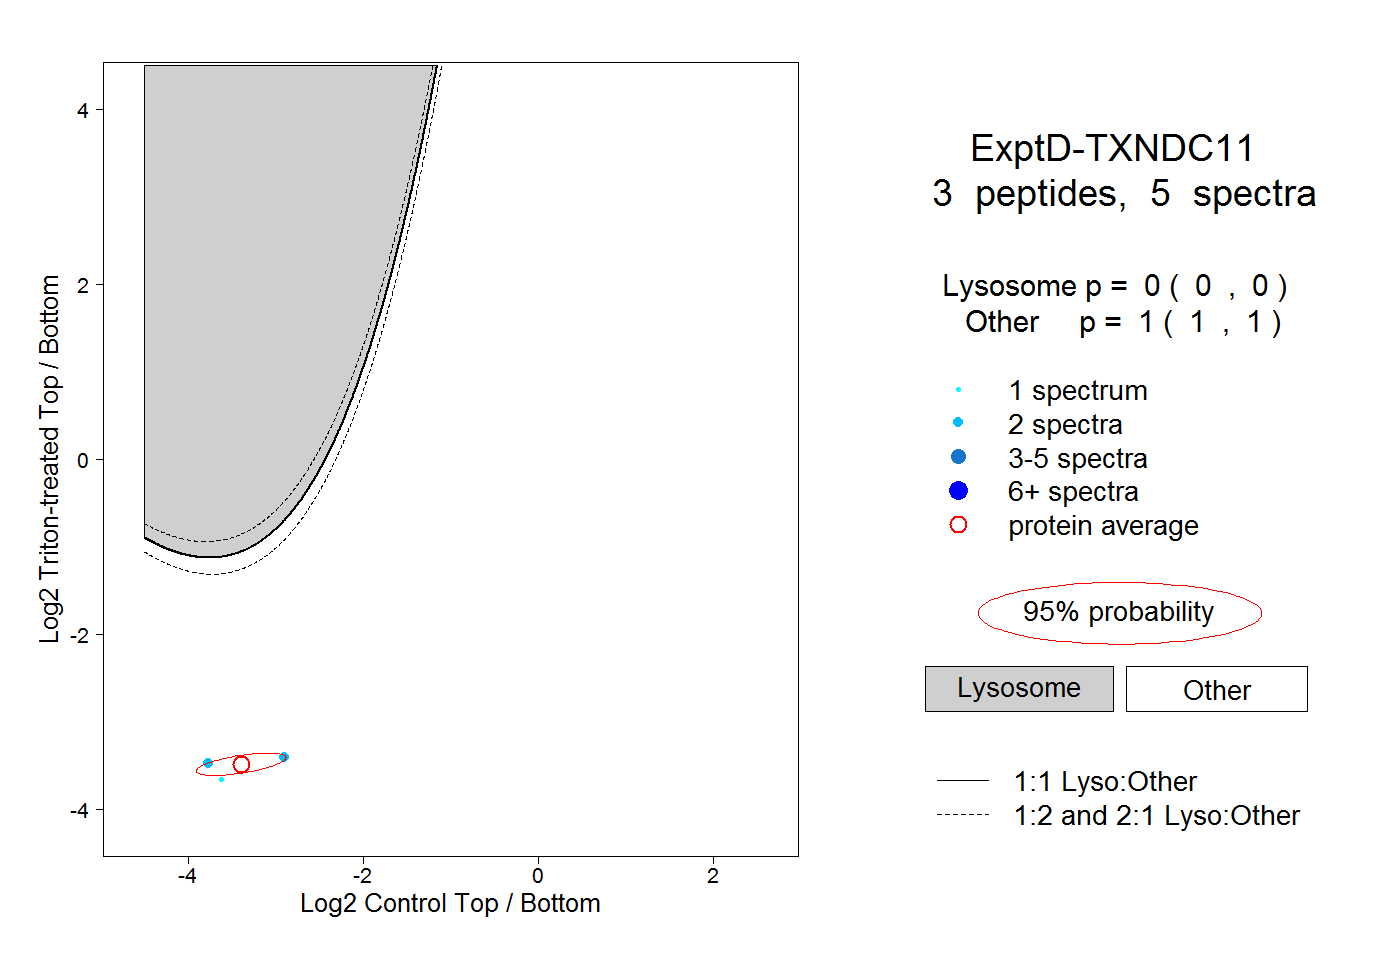 |
0.000 0.000 | 0.000 |
1.000 1.000 | 1.000 |