 8
8peptides
spectra
0.000 | 0.000
0.246 | 0.281
0.000 | 0.000
0.000 | 0.000
0.000 | 0.000
0.200 | 0.233
0.502 | 0.527
0.000 | 0.000
10peptides
spectra
0.000 | 0.000
1.000 | 1.000
| Plot | Mito | Lyso | Perox | ER | Golgi | PM | Cytosol | Nucleus | |||||
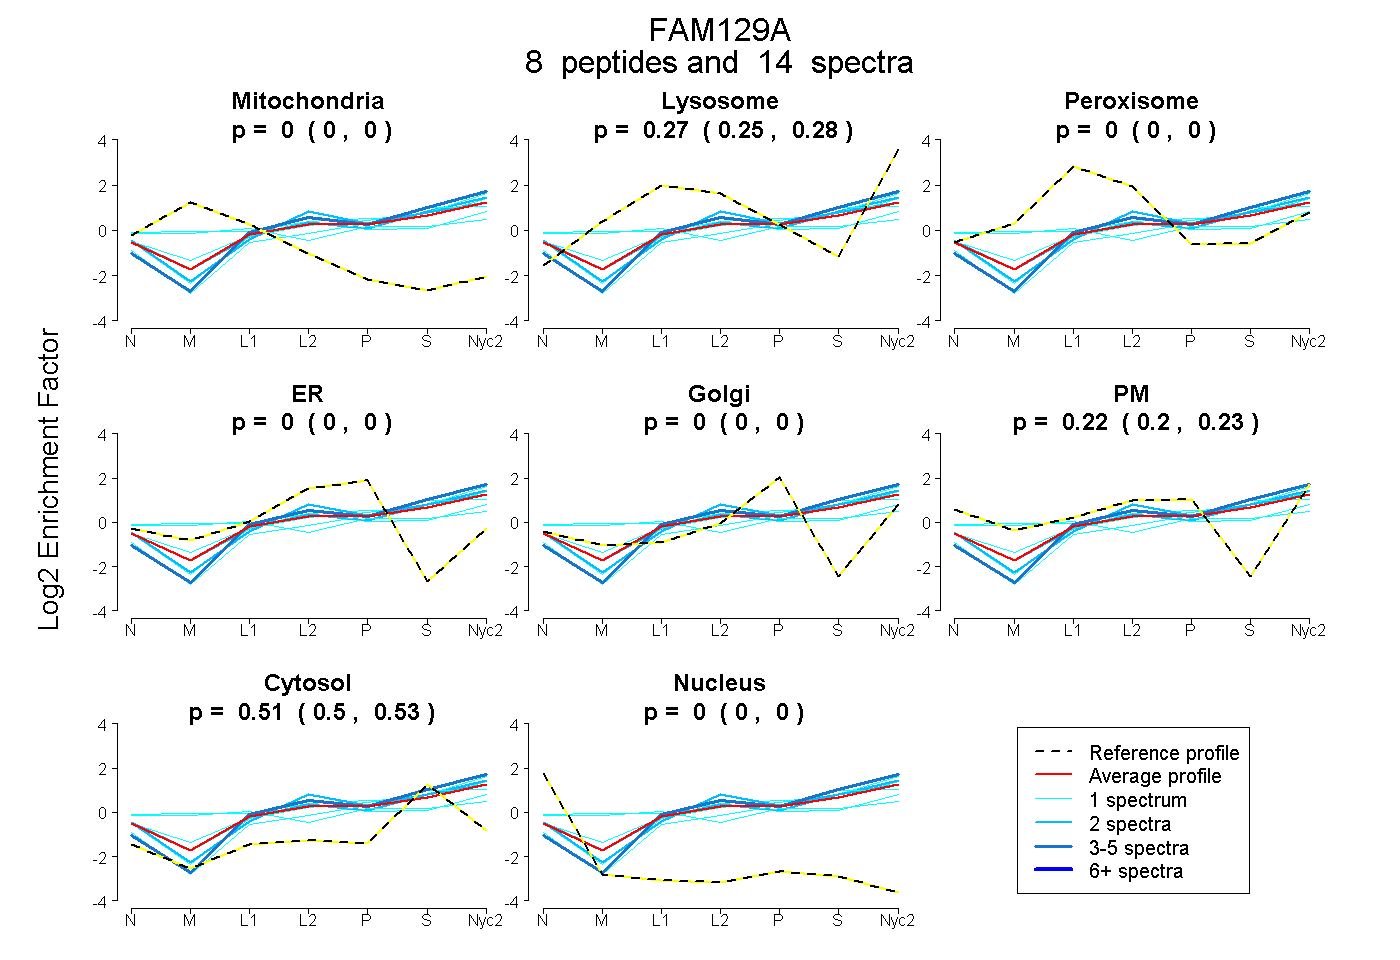
| Expt A |
8 peptides |
14 spectra |
|
0.000 0.000 | 0.000 |
0.266 0.246 | 0.281 |
0.000 0.000 | 0.000 |
0.000 0.000 | 0.000 |
0.000 0.000 | 0.000 |
0.219 0.200 | 0.233 |
0.515 0.502 | 0.527 |
0.000 0.000 | 0.000 |
||
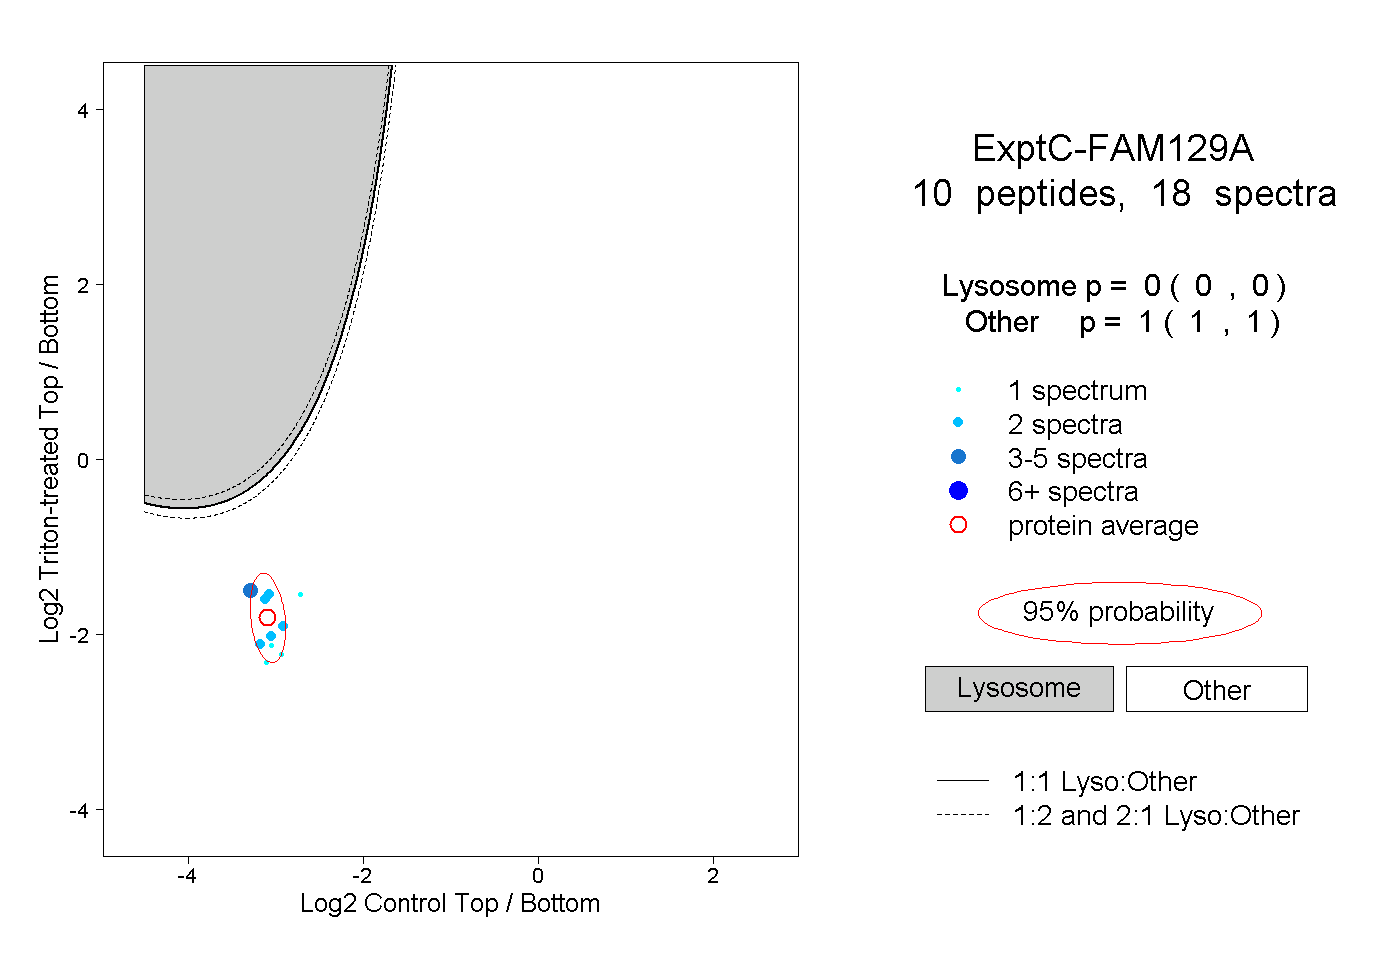
| Plot | Lyso | Other | |||||||||||
| Expt C |
10 peptides |
18 spectra |
|
0.000 0.000 | 0.000 |
1.000 1.000 | 1.000 |