 6
6peptides
spectra
0.000 | 0.000
0.000 | 0.000
0.000 | 0.000
0.000 | 0.000
0.000 | 0.000
0.065 | 0.082
0.856 | 0.866
0.055 | 0.071
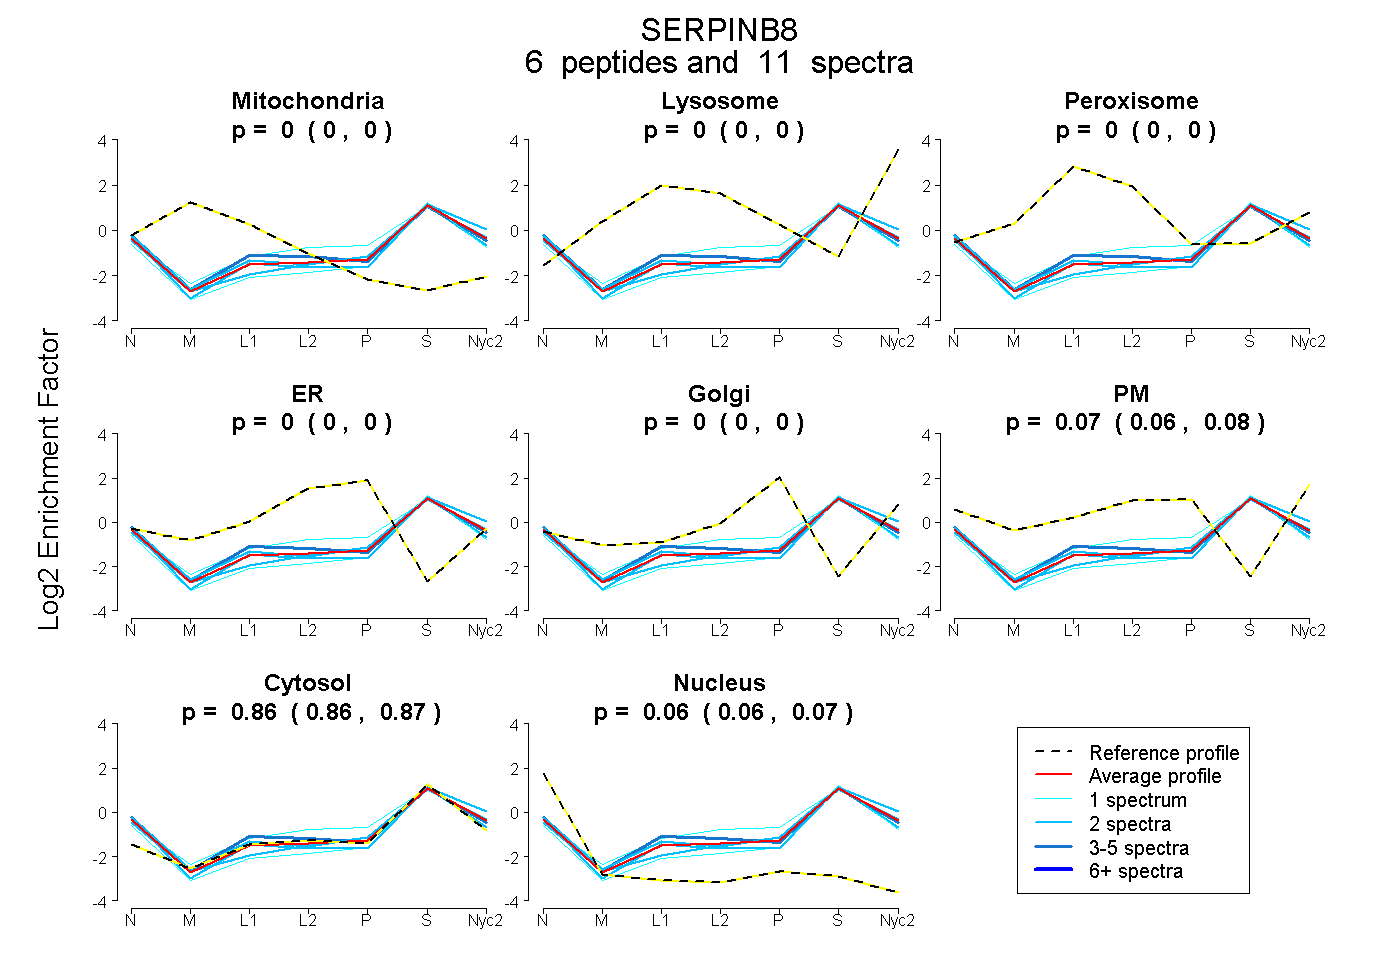
| Plot | Mito | Lyso | Perox | ER | Golgi | PM | Cytosol | Nucleus | |||||
| Expt A |
6 peptides |
11 spectra |
|
0.000 0.000 | 0.000 |
0.000 0.000 | 0.000 |
0.000 0.000 | 0.000 |
0.000 0.000 | 0.000 |
0.000 0.000 | 0.000 |
0.075 0.065 | 0.082 |
0.862 0.856 | 0.866 |
0.064 0.055 | 0.071 |
| 2 spectra, VQVFFPR | 0.000 | 0.000 | 0.000 | 0.000 | 0.000 | 0.054 | 0.883 | 0.063 | ||
| 2 spectra, SGTQYLLK | 0.000 | 0.000 | 0.000 | 0.000 | 0.000 | 0.101 | 0.835 | 0.064 | ||
| 3 spectra, INDWVLEK | 0.000 | 0.000 | 0.032 | 0.000 | 0.000 | 0.080 | 0.826 | 0.062 | ||
| 2 spectra, ILGEEDK | 0.000 | 0.000 | 0.000 | 0.000 | 0.024 | 0.013 | 0.868 | 0.095 | ||
| 1 spectrum, AITYEK | 0.000 | 0.000 | 0.000 | 0.000 | 0.000 | 0.203 | 0.797 | 0.000 | ||
| 1 spectrum, LVLVNAMYFK | 0.000 | 0.000 | 0.000 | 0.000 | 0.000 | 0.000 | 0.881 | 0.119 |
| Plot | Lyso | Other | |||||||||||
| Expt C |
5 peptides |
9 spectra |
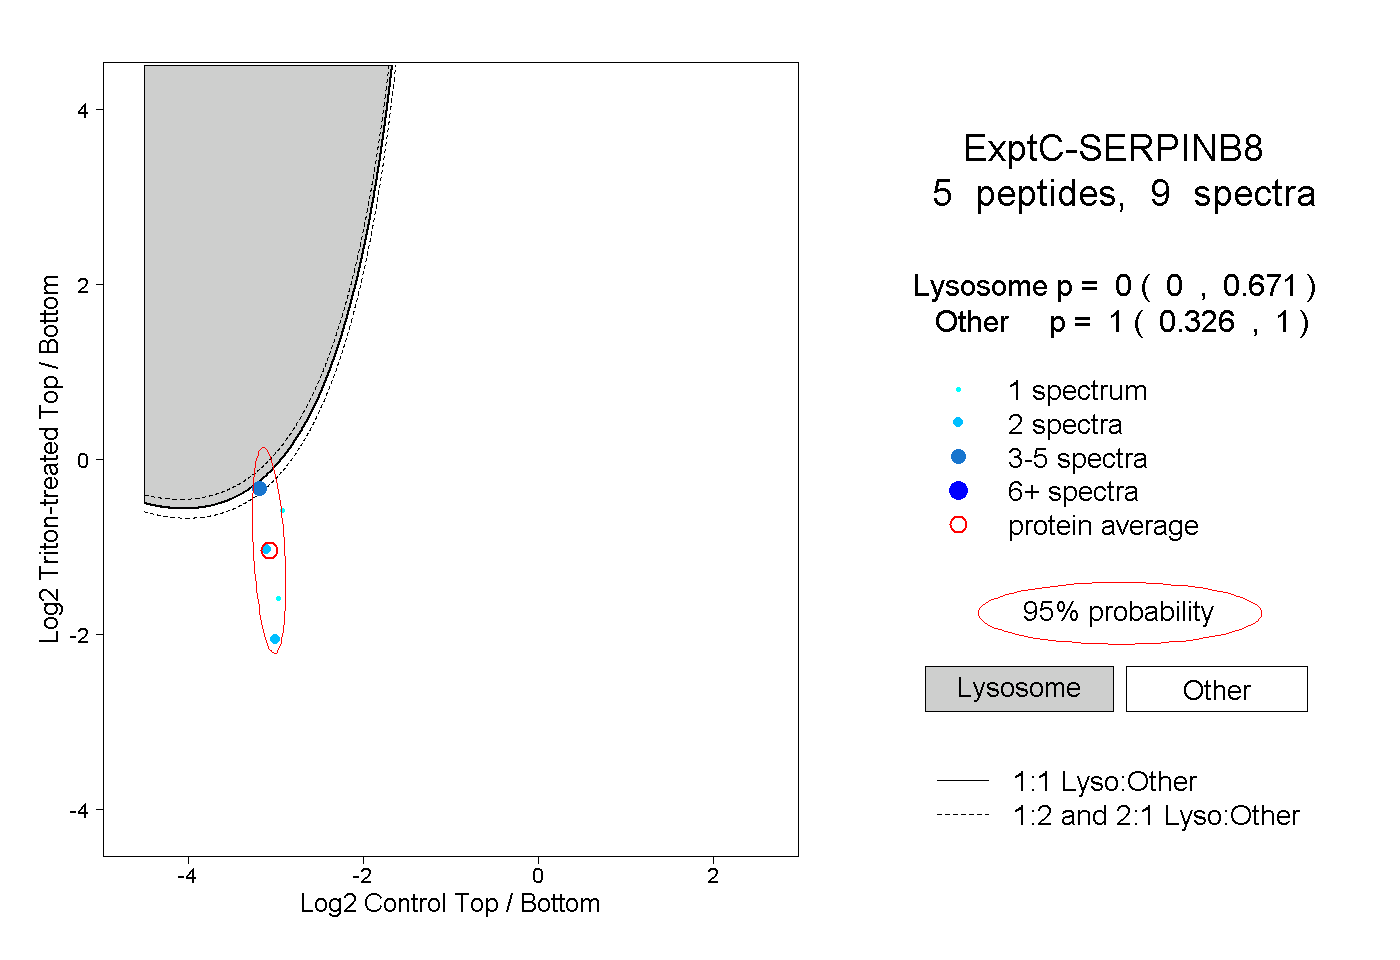 |
0.000 0.000 | 0.671 |
1.000 0.326 | 1.000 |