BPNT1
[ENSRNOP00000003249]
Main page
| | | Plot |
Mito |
Lyso |
|
Perox |
ER |
Golgi |
PM |
Cytosol |
Nucleus |
|
| Expt A |
 13
13
peptides |
30
spectra |
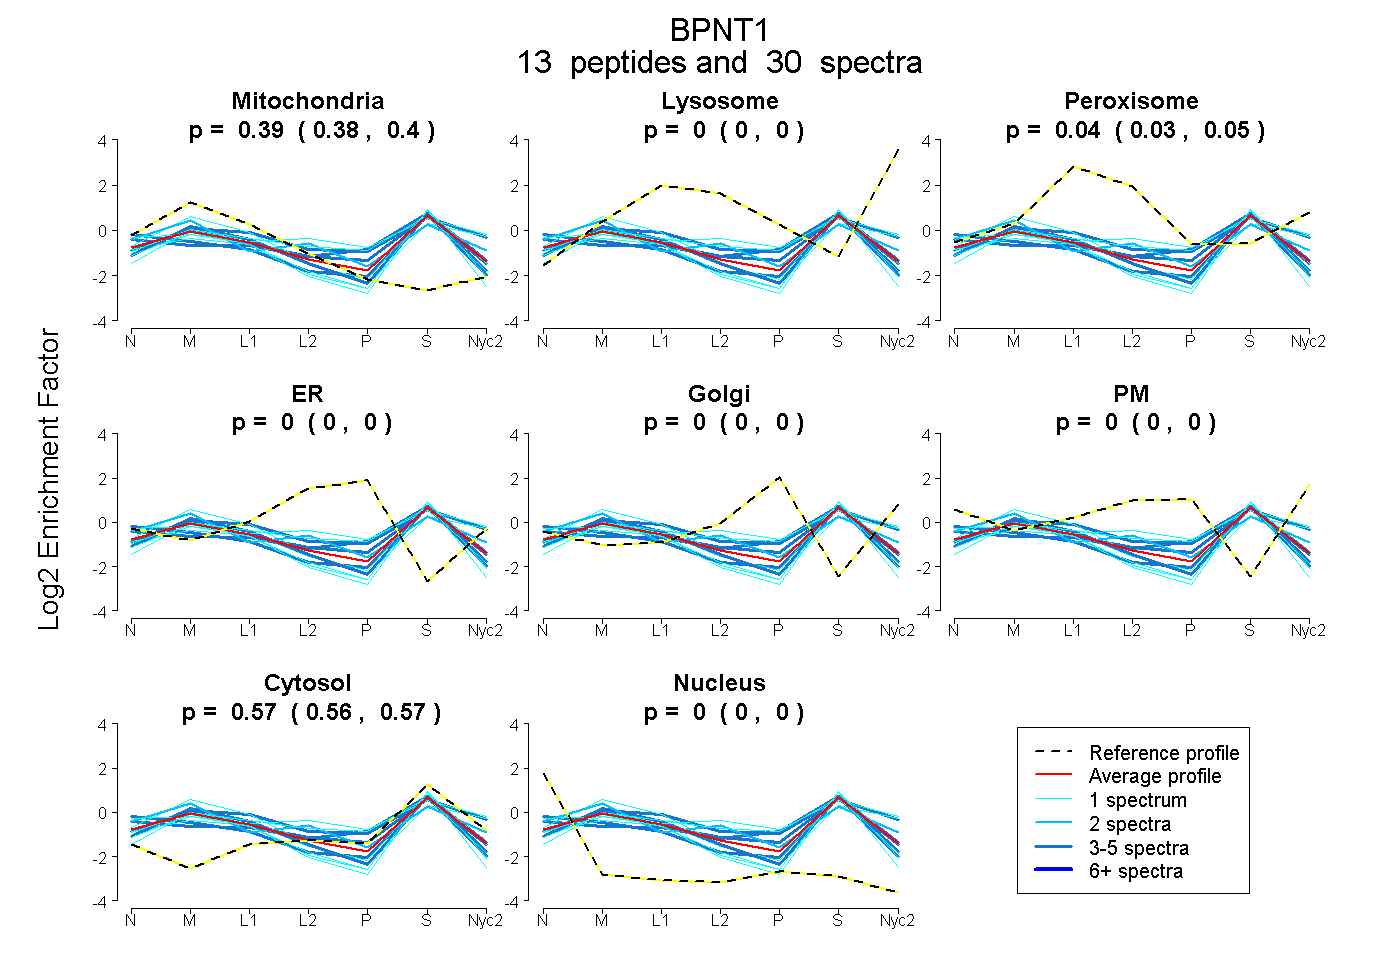 |
0.388
0.378 | 0.396 |
0.000
0.000 | 0.000 |
|
0.043
0.033 | 0.051 |
0.000
0.000 | 0.000 |
0.000
0.000 | 0.000 |
0.000
0.000 | 0.000 |
0.569
0.564 | 0.574 |
0.000
0.000 | 0.000 |
|
| | | Plot |
Mito |
|
Lyso or Perox |
|
ER |
Golgi |
PM |
Cytosol |
Nucleus |
|
| Expt B |
7
peptides |
12
spectra |
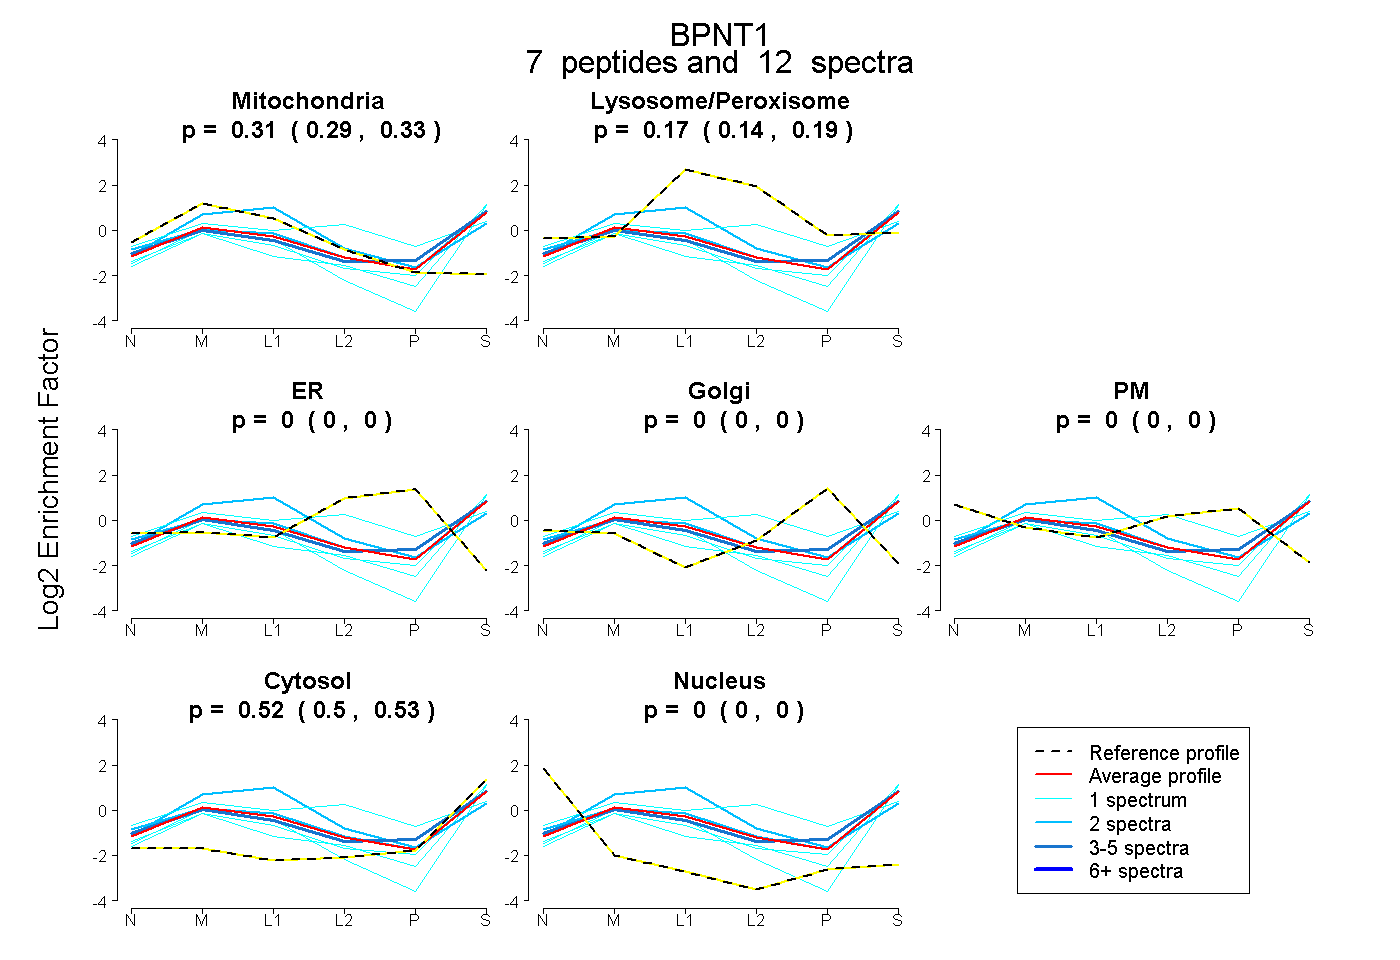 |
0.311
0.285 | 0.333 |
|
0.170
0.139 | 0.195 |
|
0.000
0.000 | 0.000 |
0.000
0.000 | 0.000 |
0.000
0.000 | 0.000 |
0.519
0.499 | 0.534 |
0.000
0.000 | 0.000 |
|
| 2 spectra, HIITTTR |
0.451 |
|
0.283 |
|
0.000 |
0.000 |
0.000 |
0.266 |
0.000 |
|
| 1 spectrum, IIQLIEGK |
0.375 |
|
0.000 |
|
0.000 |
0.000 |
0.000 |
0.625 |
0.000 |
|
| 4 spectra, NYEYYASR |
0.279 |
|
0.168 |
|
0.000 |
0.000 |
0.000 |
0.553 |
0.000 |
|
| 1 spectrum, ASAYVFASPGCK |
0.291 |
|
0.007 |
|
0.000 |
0.000 |
0.000 |
0.702 |
0.000 |
|
| 2 spectra, AGTIVR |
0.292 |
|
0.202 |
|
0.000 |
0.000 |
0.000 |
0.506 |
0.000 |
|
| 1 spectrum, MVQMSICSSLSR |
0.170 |
|
0.414 |
|
0.000 |
0.052 |
0.047 |
0.316 |
0.000 |
|
| 1 spectrum, ASSHNVLMR |
0.271 |
|
0.082 |
|
0.000 |
0.000 |
0.000 |
0.647 |
0.000 |
|
| | | Plot |
|
Lyso |
|
|
|
|
|
|
|
Other |
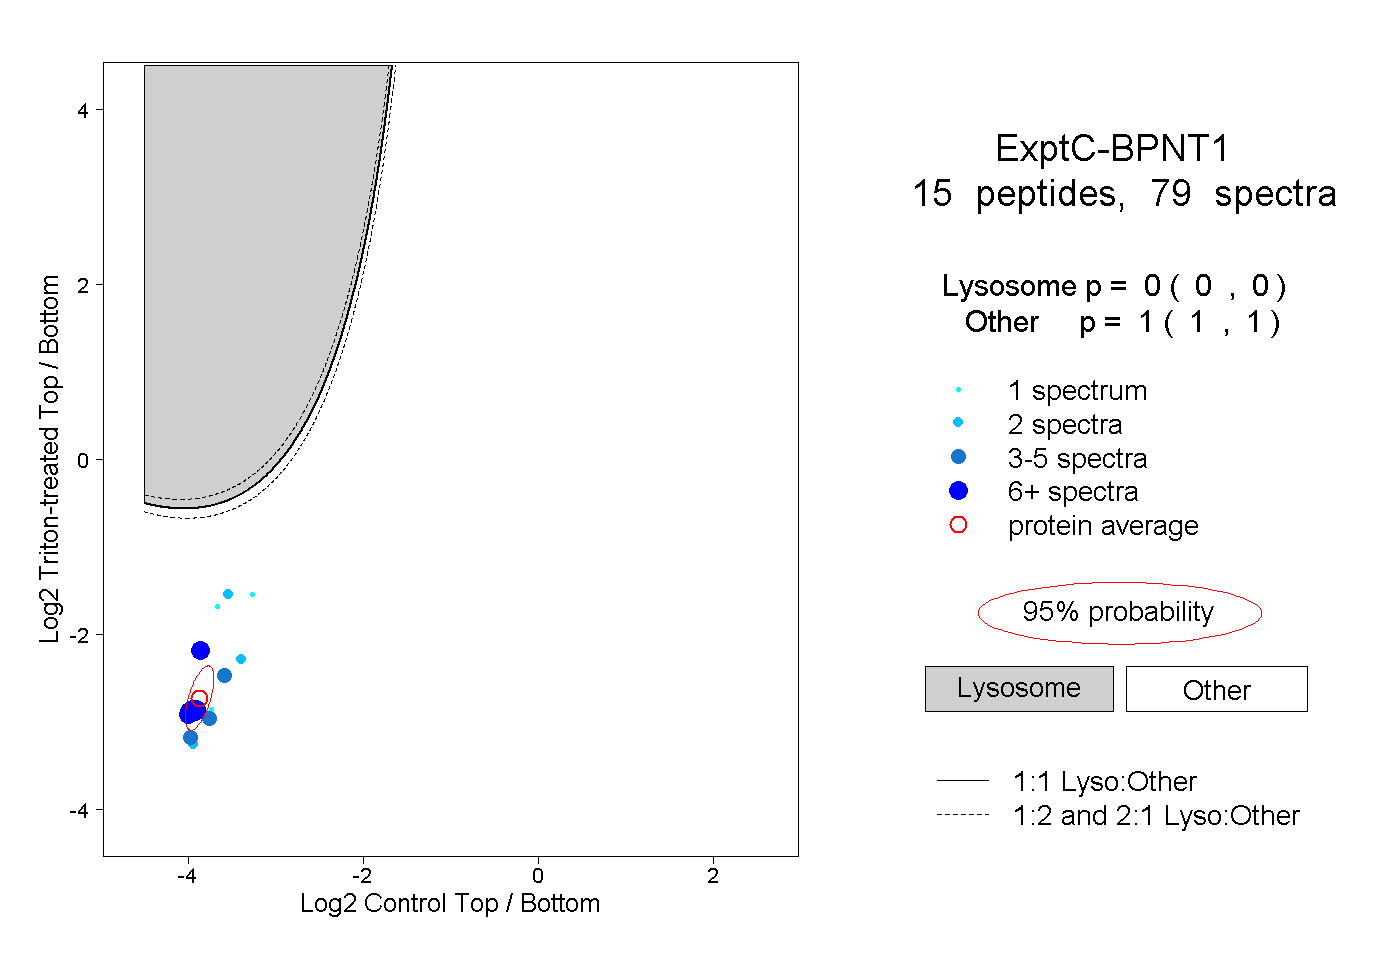
| Expt C |
15
peptides |
79
spectra |
 |
|
0.000
0.000 | 0.000 |
|
|
|
|
|
|
|
1.000
1.000 | 1.000 |
| | | Plot |
|
Lyso |
|
|
|
|
|
|
|
Other |
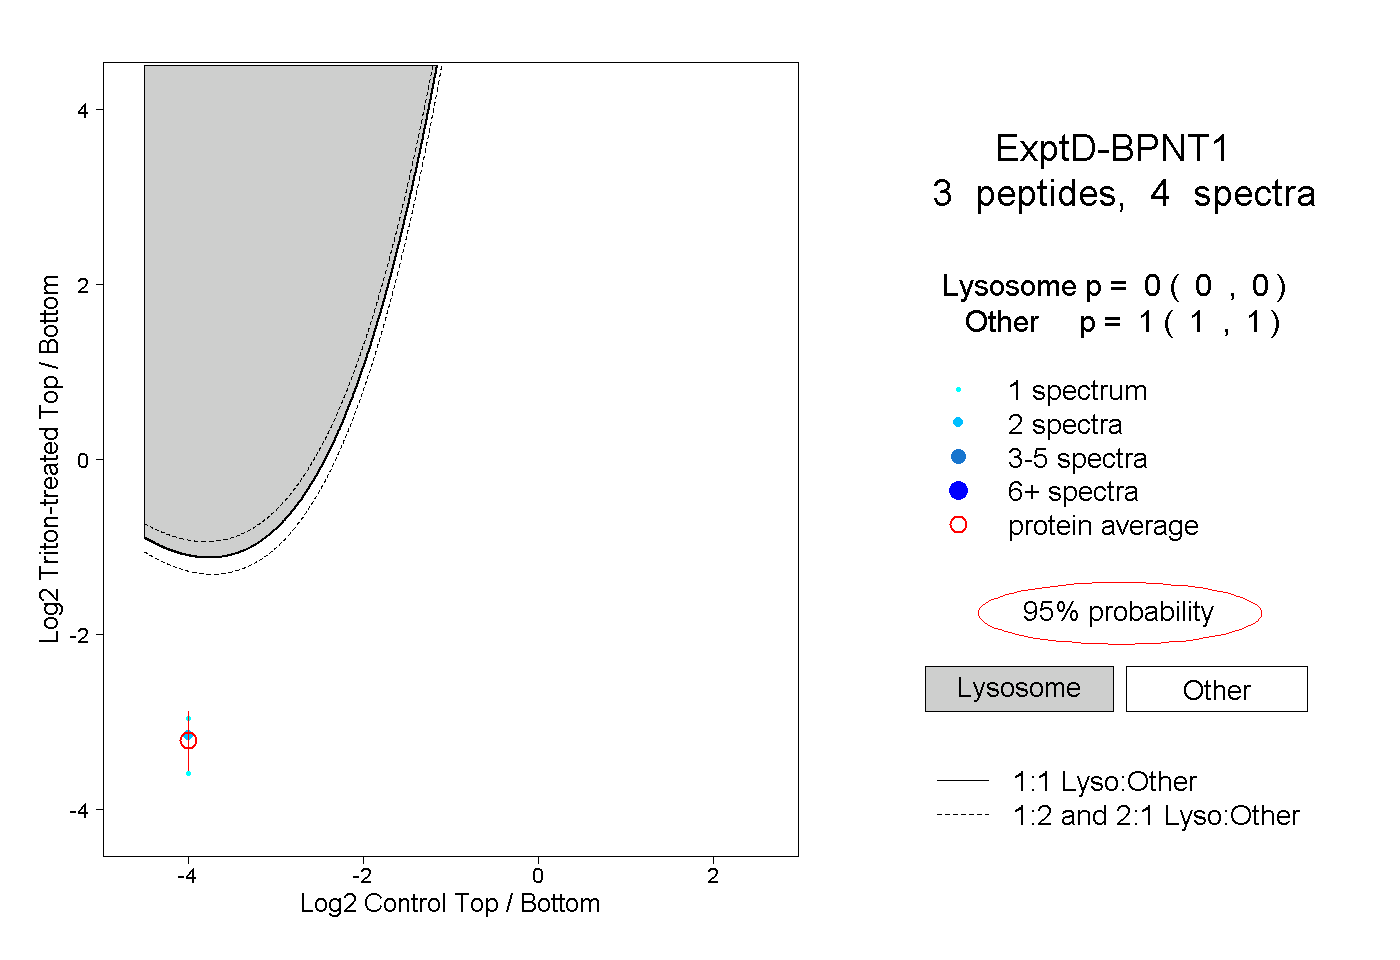
| Expt D |
3
peptides |
4
spectra |
 |
|
0.000
0.000 | 0.000 |
|
|
|
|
|
|
|
1.000
1.000 | 1.000 |