 13
13peptides
spectra
0.378 | 0.396
0.000 | 0.000
0.033 | 0.051
0.000 | 0.000
0.000 | 0.000
0.000 | 0.000
0.564 | 0.574
0.000 | 0.000
| Plot | Mito | Lyso | Perox | ER | Golgi | PM | Cytosol | Nucleus | |||||
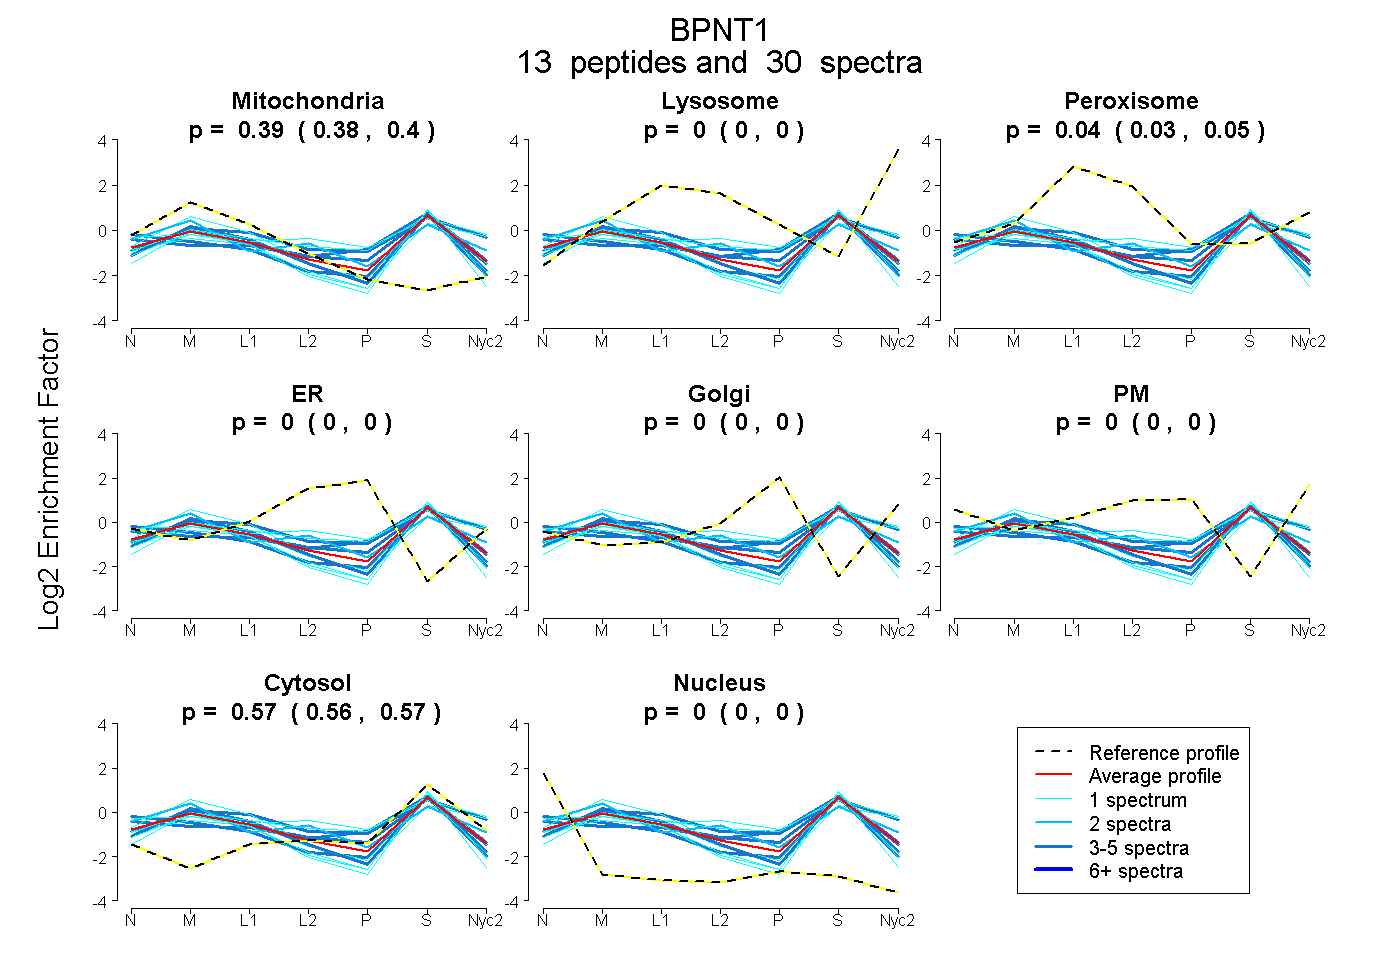
| Expt A |
13 peptides |
30 spectra |
|
0.388 0.378 | 0.396 |
0.000 0.000 | 0.000 |
0.043 0.033 | 0.051 |
0.000 0.000 | 0.000 |
0.000 0.000 | 0.000 |
0.000 0.000 | 0.000 |
0.569 0.564 | 0.574 |
0.000 0.000 | 0.000 |
| 5 spectra, HIITTTR | 0.375 | 0.000 | 0.061 | 0.000 | 0.000 | 0.000 | 0.563 | 0.000 | ||
| 1 spectrum, TSATDLQTK | 0.390 | 0.000 | 0.000 | 0.000 | 0.000 | 0.000 | 0.610 | 0.000 | ||
| 1 spectrum, ASAYVFASPGCK | 0.402 | 0.000 | 0.000 | 0.000 | 0.000 | 0.000 | 0.598 | 0.000 | ||
| 5 spectra, MVQMSICSSLSR | 0.454 | 0.000 | 0.000 | 0.000 | 0.000 | 0.000 | 0.546 | 0.000 | ||
| 3 spectra, EAPAGK | 0.361 | 0.000 | 0.000 | 0.000 | 0.000 | 0.000 | 0.579 | 0.060 | ||
| 5 spectra, ASSHNVLMR | 0.268 | 0.000 | 0.076 | 0.000 | 0.023 | 0.000 | 0.633 | 0.000 | ||
| 1 spectrum, LVTDCIAAMNPDNVLR | 0.424 | 0.000 | 0.000 | 0.000 | 0.000 | 0.000 | 0.576 | 0.000 | ||
| 1 spectrum, LTDIHGNPLQYDK | 0.388 | 0.000 | 0.000 | 0.000 | 0.000 | 0.000 | 0.612 | 0.000 | ||
| 1 spectrum, LVASAYSIAQK | 0.453 | 0.127 | 0.000 | 0.000 | 0.000 | 0.000 | 0.421 | 0.000 | ||
| 3 spectra, HMNSAGVLAALR | 0.247 | 0.130 | 0.124 | 0.000 | 0.000 | 0.000 | 0.499 | 0.000 | ||
| 1 spectrum, VGGAGNK | 0.152 | 0.007 | 0.189 | 0.000 | 0.000 | 0.150 | 0.503 | 0.000 | ||
| 2 spectra, NYEYYASR | 0.413 | 0.044 | 0.074 | 0.000 | 0.000 | 0.000 | 0.469 | 0.000 | ||
| 1 spectrum, WDTCAPEVILHAVGGK | 0.342 | 0.000 | 0.125 | 0.000 | 0.000 | 0.000 | 0.533 | 0.000 |
| Plot | Mito | Lyso or Perox | ER | Golgi | PM | Cytosol | Nucleus | ||||||
| Expt B |
7 peptides |
12 spectra |
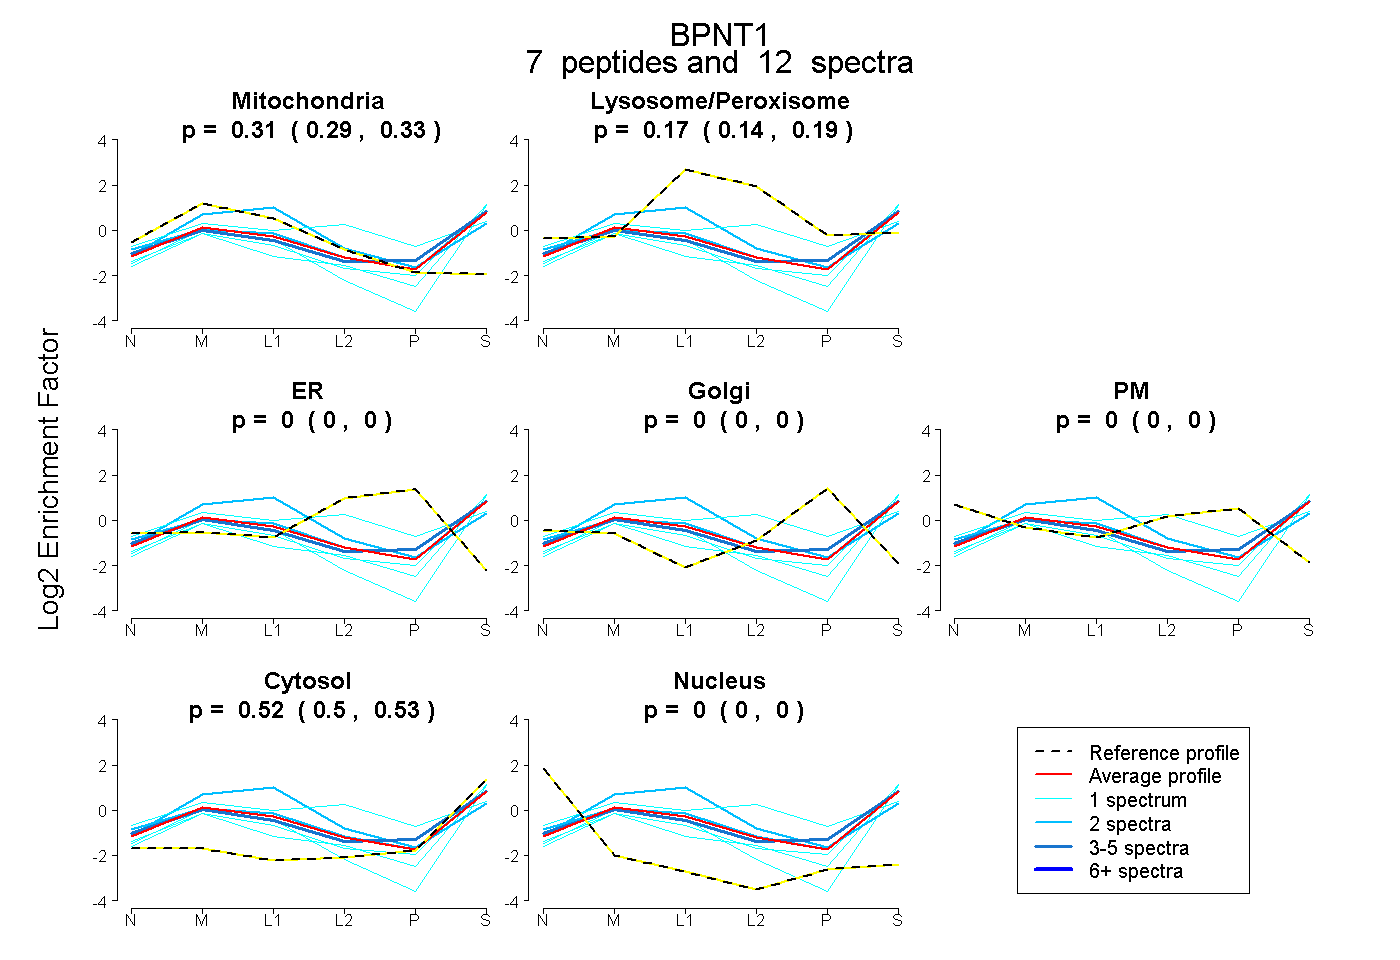 |
0.311 0.285 | 0.333 |
0.170 0.139 | 0.195 |
0.000 0.000 | 0.000 |
0.000 0.000 | 0.000 |
0.000 0.000 | 0.000 |
0.519 0.499 | 0.534 |
0.000 0.000 | 0.000 |
|||
| Plot | Lyso | Other | |||||||||||
| Expt C |
15 peptides |
79 spectra |
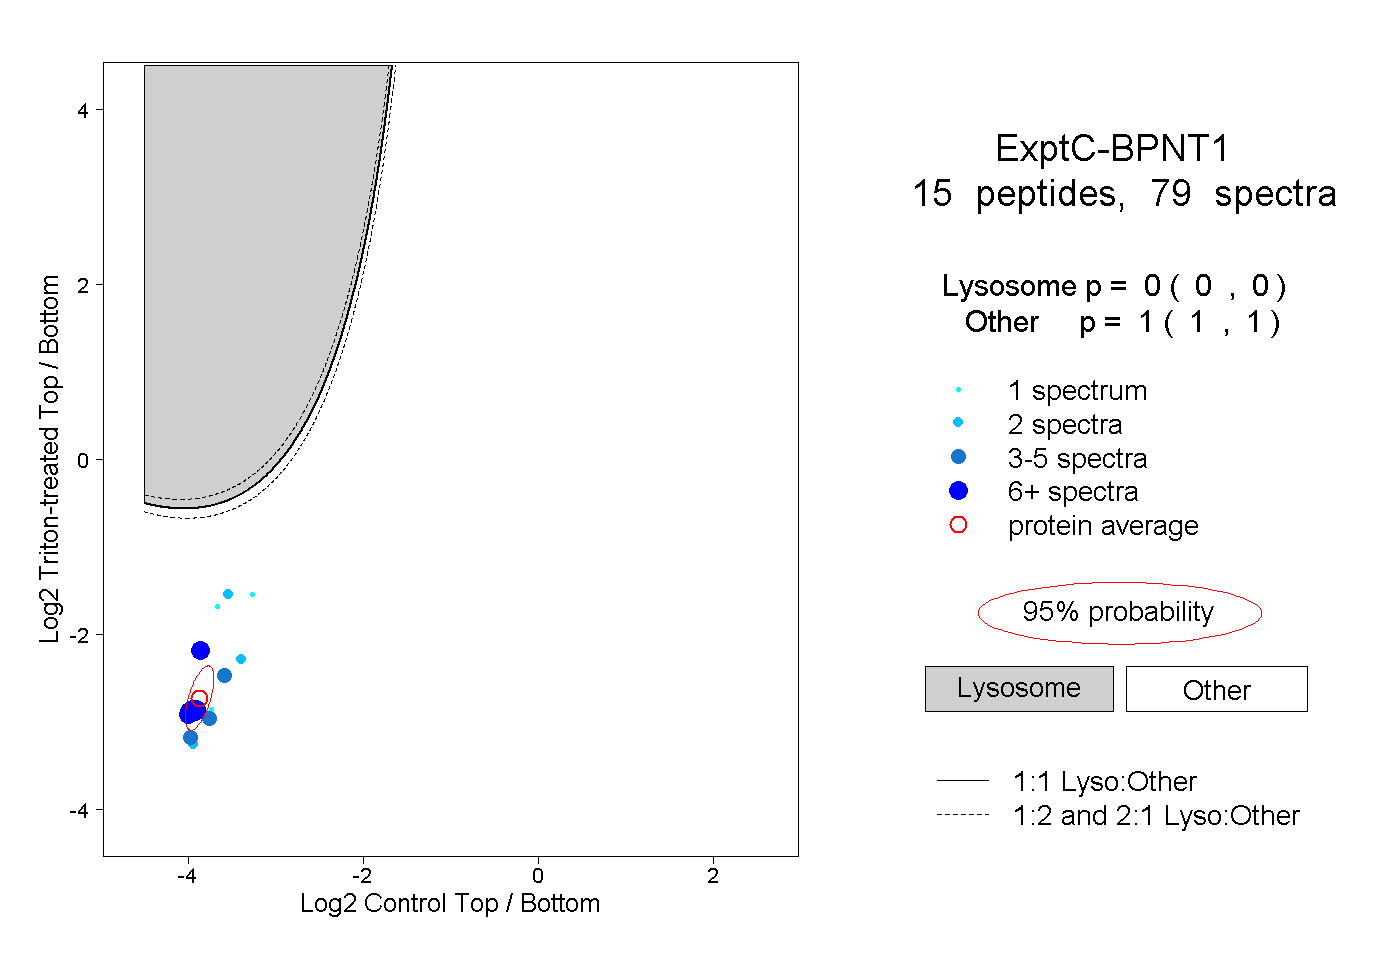 |
0.000 0.000 | 0.000 |
1.000 1.000 | 1.000 |
||||||||
| Plot | Lyso | Other | |||||||||||
| Expt D |
3 peptides |
4 spectra |
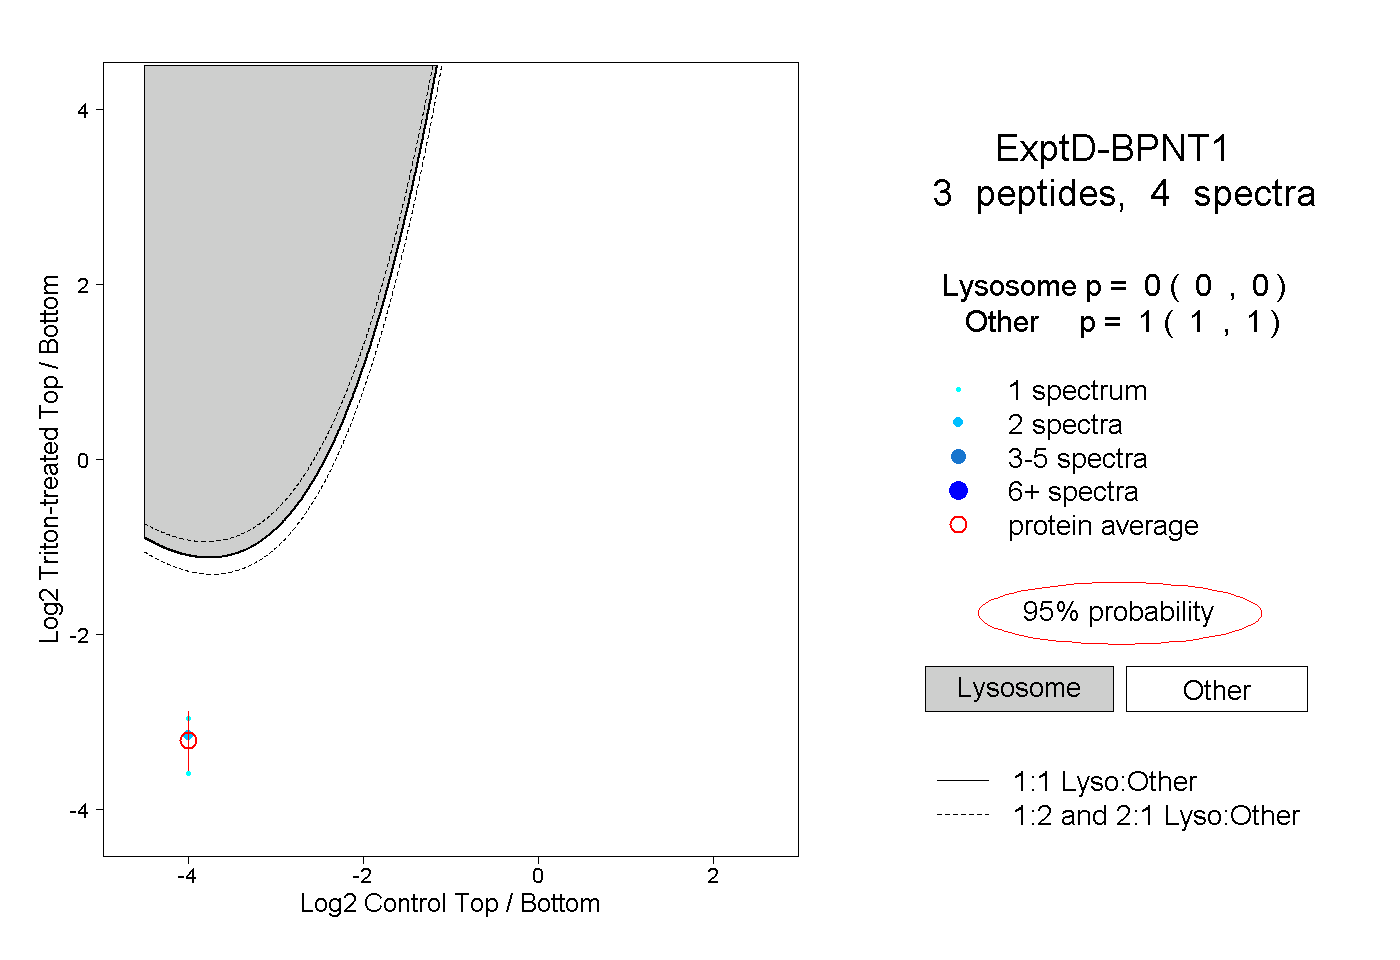 |
0.000 0.000 | 0.000 |
1.000 1.000 | 1.000 |