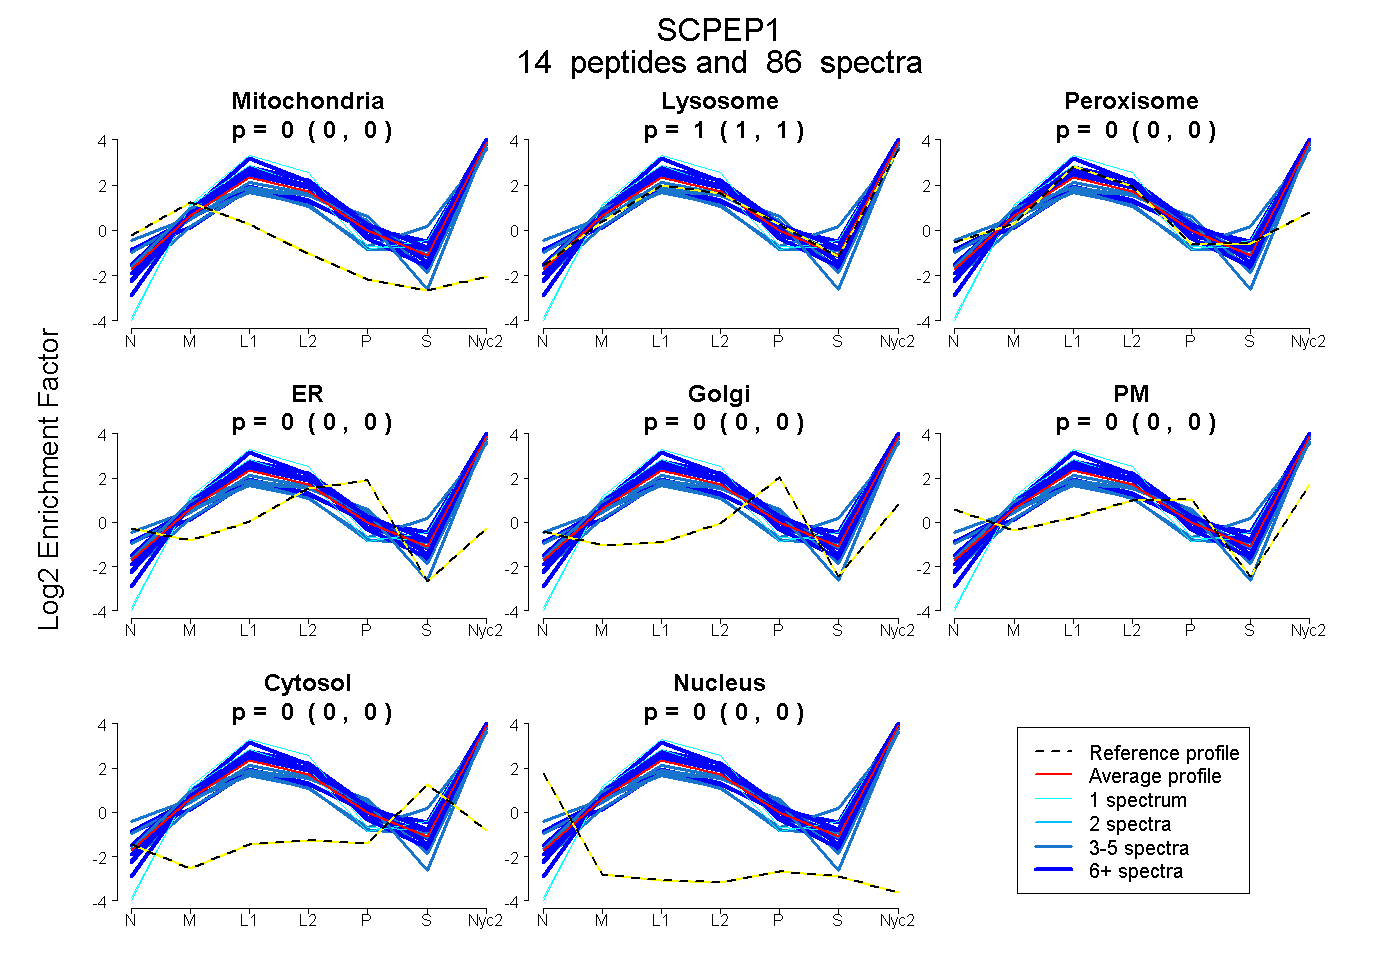
 14
14peptides
spectra
0.000 | 0.000
1.000 | 1.000
0.000 | 0.000
0.000 | 0.000
0.000 | 0.000
0.000 | 0.000
0.000 | 0.000
0.000 | 0.000
| Plot | Mito | Lyso | Perox | ER | Golgi | PM | Cytosol | Nucleus | |||||
| Expt A |
14 peptides |
86 spectra |
|
0.000 0.000 | 0.000 |
1.000 1.000 | 1.000 |
0.000 0.000 | 0.000 |
0.000 0.000 | 0.000 |
0.000 0.000 | 0.000 |
0.000 0.000 | 0.000 |
0.000 0.000 | 0.000 |
0.000 0.000 | 0.000 |
| 3 spectra, SYENLAFYWILK | 0.000 | 0.923 | 0.000 | 0.000 | 0.000 | 0.077 | 0.000 | 0.000 | ||
| 6 spectra, SFFDCHK | 0.000 | 0.982 | 0.018 | 0.000 | 0.000 | 0.000 | 0.000 | 0.000 | ||
| 1 spectrum, NTDGVNFYNILTK | 0.000 | 1.000 | 0.000 | 0.000 | 0.000 | 0.000 | 0.000 | 0.000 | ||
| 7 spectra, AIQQGTIK | 0.000 | 1.000 | 0.000 | 0.000 | 0.000 | 0.000 | 0.000 | 0.000 | ||
| 1 spectrum, SSETSAFVK | 0.000 | 1.000 | 0.000 | 0.000 | 0.000 | 0.000 | 0.000 | 0.000 | ||
| 3 spectra, ALYTNPK | 0.000 | 0.868 | 0.000 | 0.000 | 0.000 | 0.000 | 0.132 | 0.000 | ||
| 4 spectra, AEMIIEK | 0.000 | 0.940 | 0.000 | 0.000 | 0.000 | 0.000 | 0.000 | 0.060 | ||
| 6 spectra, MAAGISLELHK | 0.000 | 1.000 | 0.000 | 0.000 | 0.000 | 0.000 | 0.000 | 0.000 | ||
| 3 spectra, EFQTVPFYIFSESYGGK | 0.000 | 0.904 | 0.000 | 0.000 | 0.008 | 0.088 | 0.000 | 0.000 | ||
| 5 spectra, EATQLWGK | 0.000 | 0.972 | 0.000 | 0.000 | 0.000 | 0.028 | 0.000 | 0.000 | ||
| 10 spectra, DLDTVASDMMVLLK | 0.000 | 0.946 | 0.000 | 0.000 | 0.000 | 0.050 | 0.000 | 0.004 | ||
| 18 spectra, WPQLSR | 0.000 | 1.000 | 0.000 | 0.000 | 0.000 | 0.000 | 0.000 | 0.000 | ||
| 9 spectra, AGHMVPADQGDMALK | 0.000 | 0.957 | 0.000 | 0.000 | 0.000 | 0.000 | 0.043 | 0.000 | ||
| 10 spectra, EVWDYVTVR | 0.000 | 1.000 | 0.000 | 0.000 | 0.000 | 0.000 | 0.000 | 0.000 |
| Plot | Mito | Lyso or Perox | ER | Golgi | PM | Cytosol | Nucleus | ||||||
| Expt B |
12 peptides |
39 spectra |
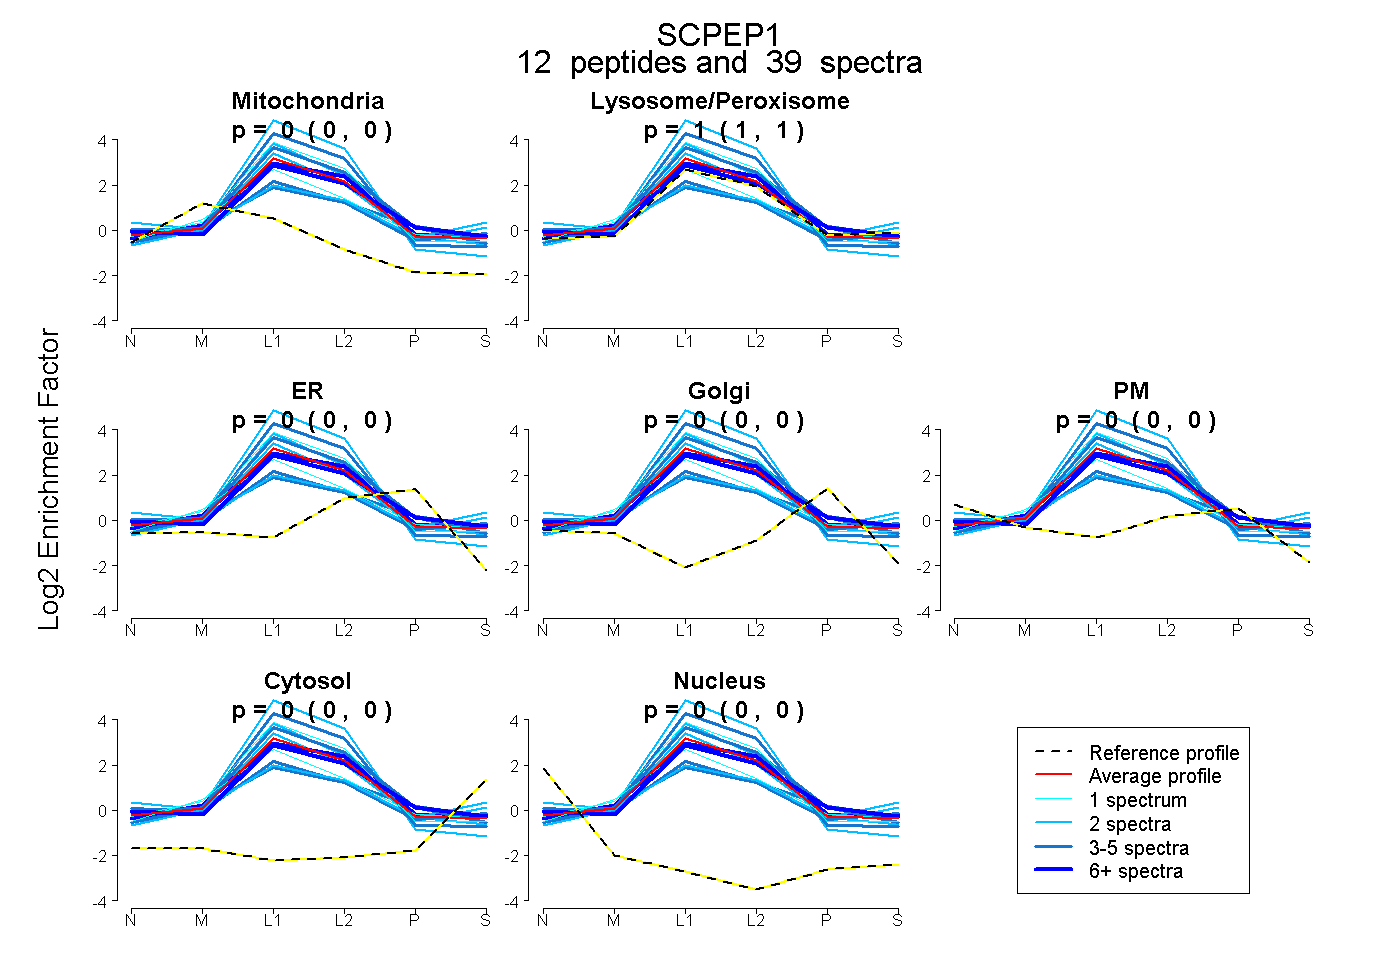 |
0.000 0.000 | 0.000 |
1.000 1.000 | 1.000 |
0.000 0.000 | 0.000 |
0.000 0.000 | 0.000 |
0.000 0.000 | 0.000 |
0.000 0.000 | 0.000 |
0.000 0.000 | 0.000 |
|||
| Plot | Lyso | Other | |||||||||||
| Expt C |
14 peptides |
268 spectra |
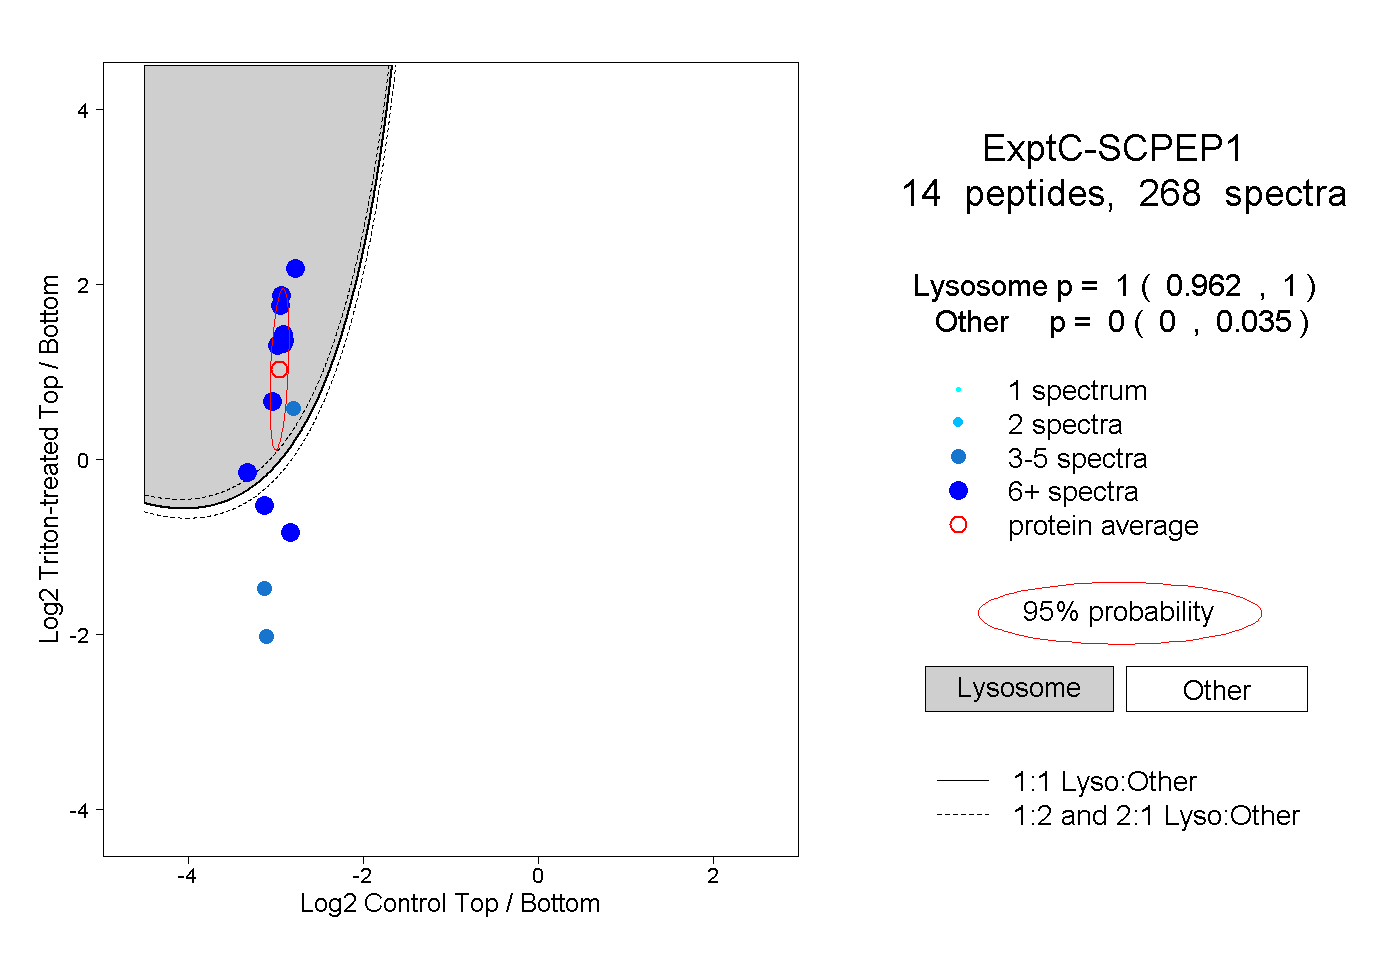 |
1.000 0.962 | 1.000 |
0.000 0.000 | 0.035 |
||||||||
| Plot | Lyso | Other | |||||||||||
| Expt D |
8 peptides |
21 spectra |
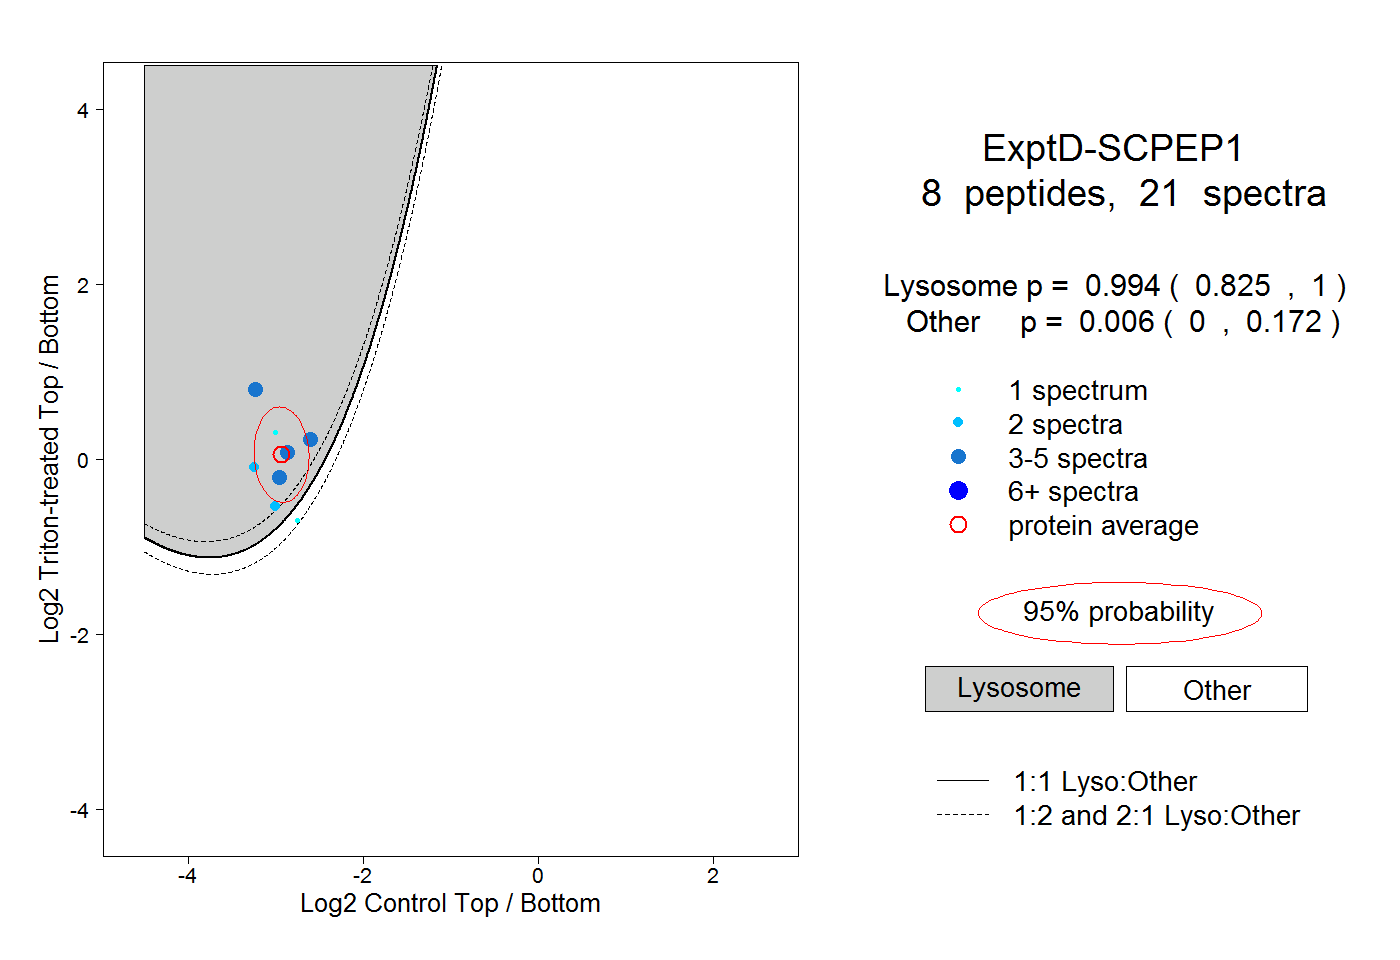 |
0.994 0.825 | 1.000 |
0.006 0.000 | 0.172 |