 2
2peptides
spectra
0.000 | 0.198
0.000 | 0.000
0.000 | 0.190
0.000 | 0.222
0.000 | 0.138
0.000 | 0.262
0.055 | 0.384
0.355 | 0.618
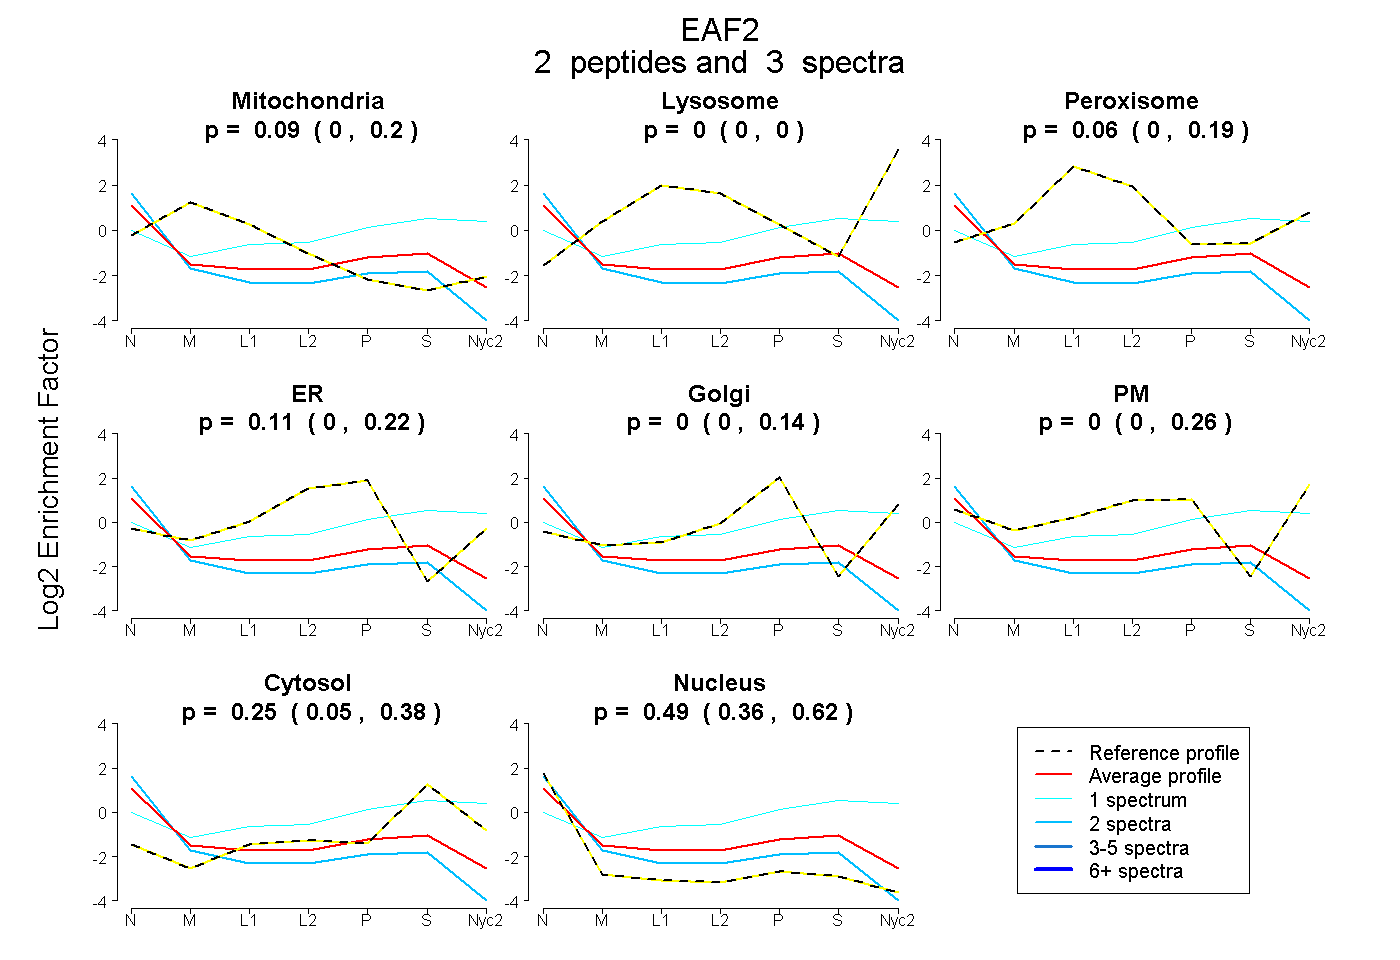
| Plot | Mito | Lyso | Perox | ER | Golgi | PM | Cytosol | Nucleus | |||||
| Expt A |
2 peptides |
3 spectra |
|
0.085 0.000 | 0.198 |
0.000 0.000 | 0.000 |
0.060 0.000 | 0.190 |
0.115 0.000 | 0.222 |
0.000 0.000 | 0.138 |
0.000 0.000 | 0.262 |
0.246 0.055 | 0.384 |
0.494 0.355 | 0.618 |
| 1 spectrum, LYDNSALLMSTLR | 0.000 | 0.000 | 0.031 | 0.000 | 0.000 | 0.408 | 0.561 | 0.000 | ||
| 2 spectra, SSPSGPR | 0.162 | 0.000 | 0.000 | 0.030 | 0.000 | 0.000 | 0.072 | 0.736 |