 10
10peptides
spectra
0.000 | 0.075
0.000 | 0.000
0.000 | 0.037
0.820 | 0.869
0.000 | 0.000
0.000 | 0.000
0.000 | 0.042
0.062 | 0.113
6peptides
spectra
0.000 | 0.000
1.000 | 1.000
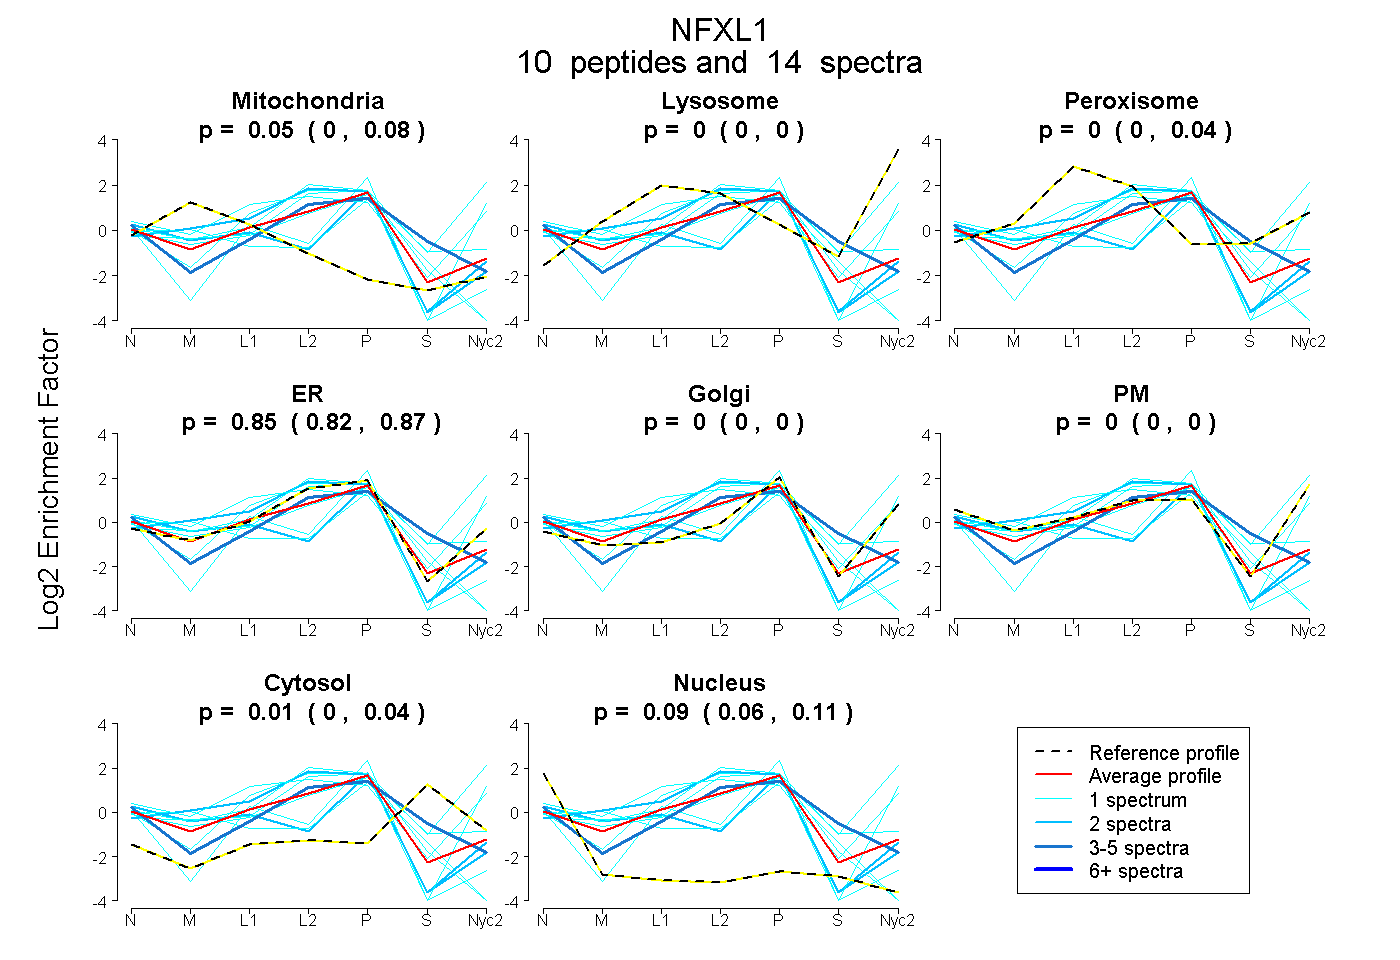
| Plot | Mito | Lyso | Perox | ER | Golgi | PM | Cytosol | Nucleus | |||||
| Expt A |
10 peptides |
14 spectra |
|
0.048 0.000 | 0.075 |
0.000 0.000 | 0.000 |
0.000 0.000 | 0.037 |
0.854 0.820 | 0.869 |
0.000 0.000 | 0.000 |
0.000 0.000 | 0.000 |
0.013 0.000 | 0.042 |
0.086 0.062 | 0.113 |
||
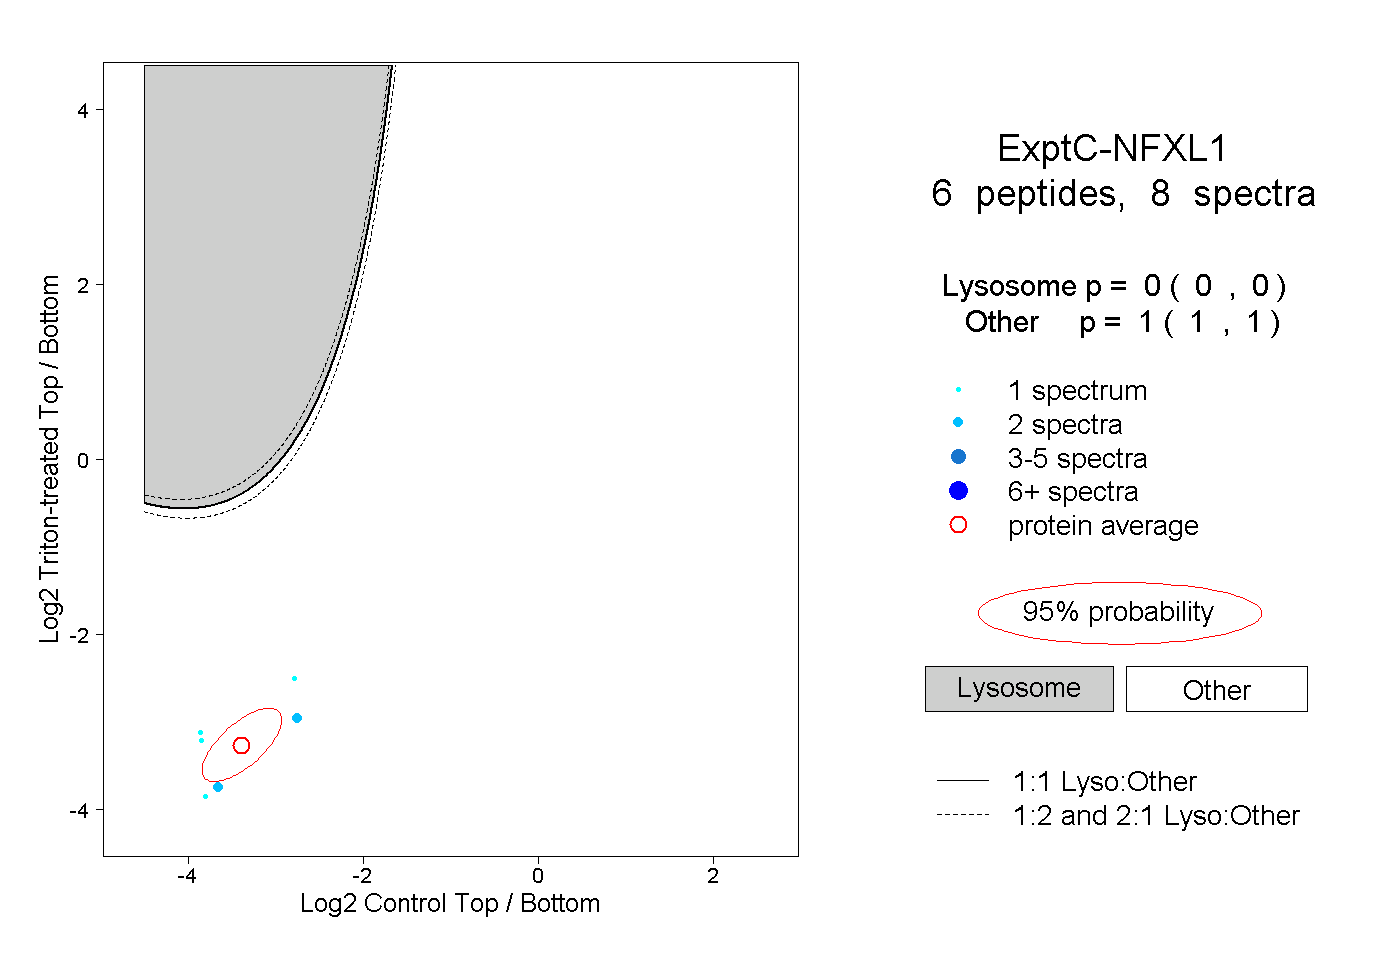
| Plot | Lyso | Other | |||||||||||
| Expt C |
6 peptides |
8 spectra |
|
0.000 0.000 | 0.000 |
1.000 1.000 | 1.000 |
| 2 spectra, AGPECLQCEEGCSK | 0.000 | 1.000 | ||||||||
| 2 spectra, QQAELEAFENR | 0.000 | 1.000 | ||||||||
| 1 spectrum, SCPCQK | 0.000 | 1.000 | ||||||||
| 1 spectrum, YYCYCGK | 0.000 | 1.000 | ||||||||
| 1 spectrum, ITTADVSEK | 0.000 | 1.000 | ||||||||
| 1 spectrum, TTRPPK | 0.000 | 1.000 |
| Plot | Lyso | Other | |||||||||||
| Expt D |
2 peptides |
2 spectra |
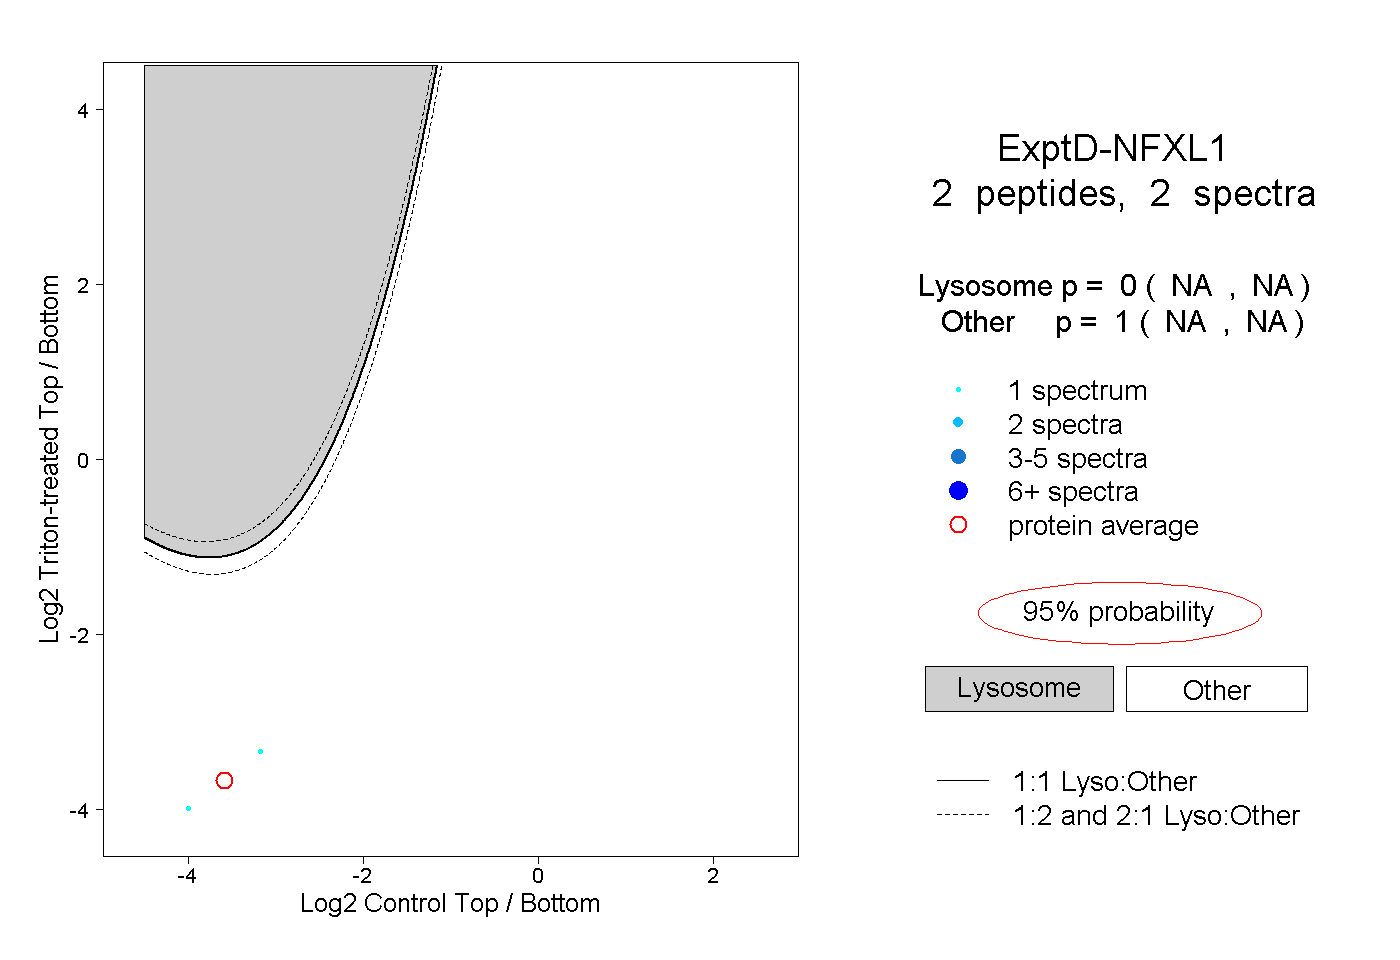 |
0.000 NA | NA |
1.000 NA | NA |