 10
10peptides
spectra
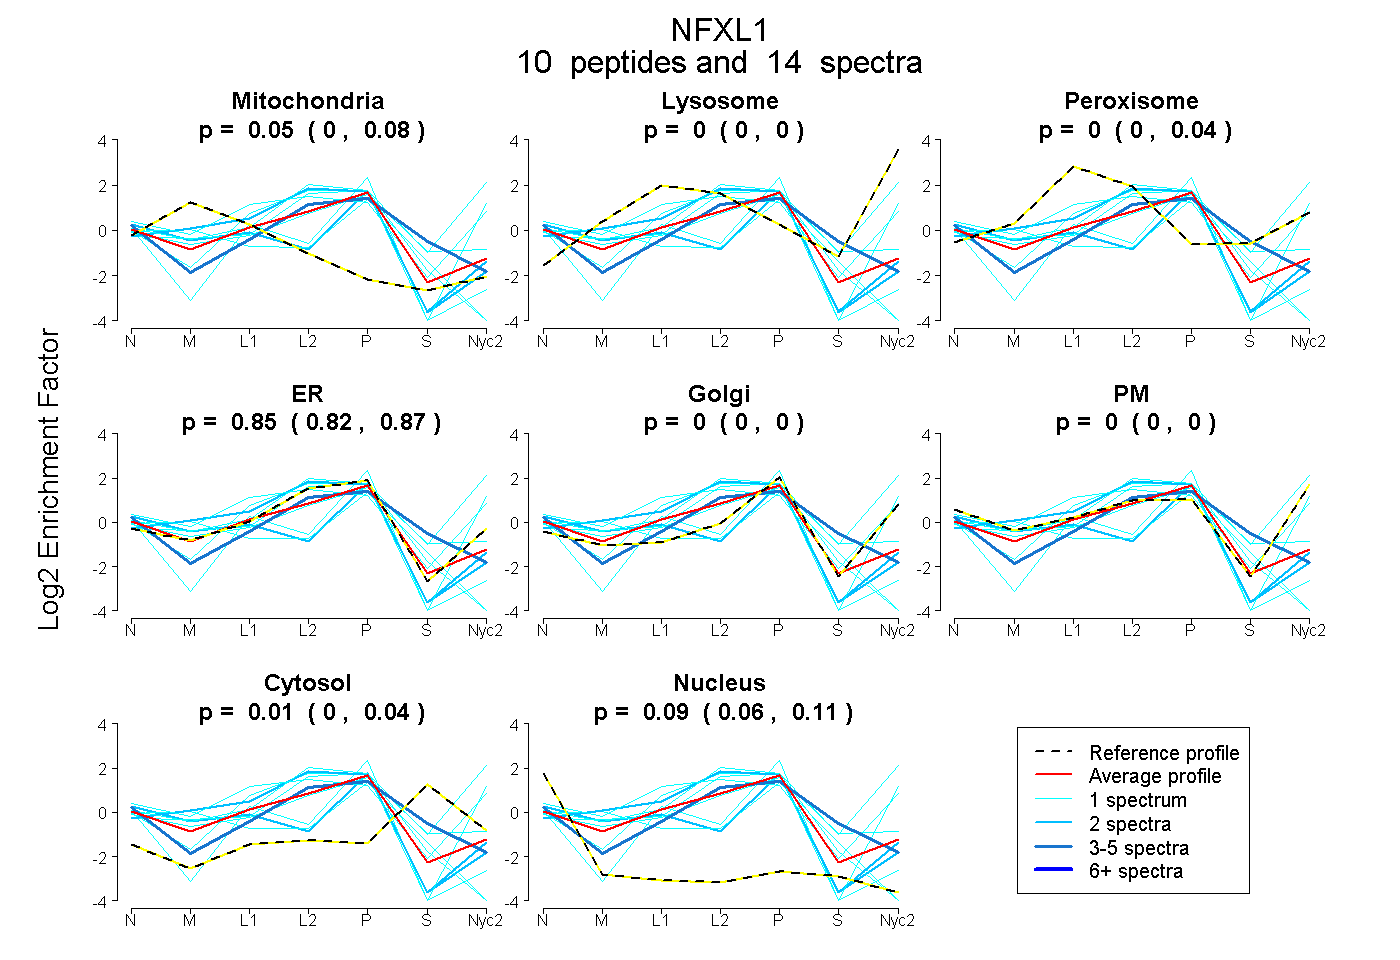
0.000 | 0.075
0.000 | 0.000
0.000 | 0.037
0.820 | 0.869
0.000 | 0.000
0.000 | 0.000
0.000 | 0.042
0.062 | 0.113
| Plot | Mito | Lyso | Perox | ER | Golgi | PM | Cytosol | Nucleus | |||||
| Expt A |
10 peptides |
14 spectra |
|
0.048 0.000 | 0.075 |
0.000 0.000 | 0.000 |
0.000 0.000 | 0.037 |
0.854 0.820 | 0.869 |
0.000 0.000 | 0.000 |
0.000 0.000 | 0.000 |
0.013 0.000 | 0.042 |
0.086 0.062 | 0.113 |
| 3 spectra, VTEVDGCPGR | 0.000 | 0.000 | 0.000 | 0.652 | 0.000 | 0.000 | 0.310 | 0.038 | ||
| 1 spectrum, SCPCQK | 0.000 | 0.000 | 0.255 | 0.303 | 0.000 | 0.442 | 0.000 | 0.000 | ||
| 1 spectrum, AGPECLQCEEGCSK | 0.145 | 0.000 | 0.000 | 0.746 | 0.000 | 0.000 | 0.000 | 0.110 | ||
| 2 spectra, AATPGPAGHK | 0.150 | 0.000 | 0.000 | 0.535 | 0.144 | 0.000 | 0.000 | 0.171 | ||
| 1 spectrum, QQAELEAFENR | 0.000 | 0.331 | 0.000 | 0.261 | 0.037 | 0.311 | 0.060 | 0.000 | ||
| 1 spectrum, IVANTFITYTTHTDGDVHELEK | 0.263 | 0.000 | 0.000 | 0.456 | 0.000 | 0.000 | 0.055 | 0.227 | ||
| 2 spectra, QWSCQLPCGR | 0.125 | 0.000 | 0.000 | 0.875 | 0.000 | 0.000 | 0.000 | 0.000 | ||
| 1 spectrum, CGHLCPISCHDQALVK | 0.004 | 0.000 | 0.030 | 0.726 | 0.000 | 0.000 | 0.241 | 0.000 | ||
| 1 spectrum, GSGGAVPSAPGPR | 0.000 | 0.000 | 0.000 | 0.713 | 0.000 | 0.000 | 0.000 | 0.287 | ||
| 1 spectrum, TTRPPK | 0.000 | 0.000 | 0.000 | 0.506 | 0.000 | 0.494 | 0.000 | 0.000 |
| Plot | Lyso | Other | |||||||||||
| Expt C |
6 peptides |
8 spectra |
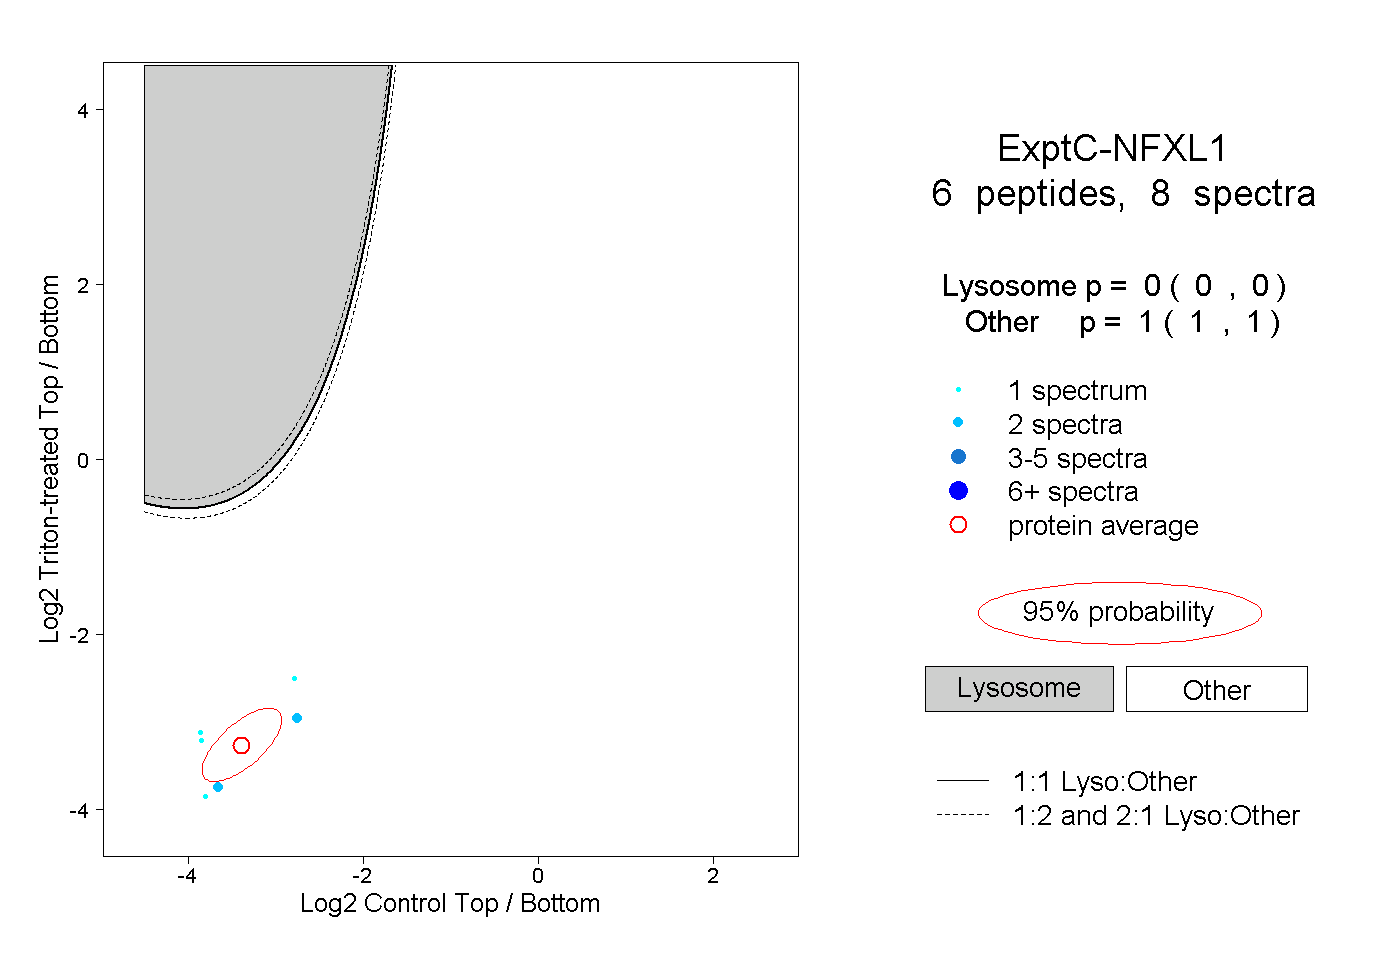 |
0.000 0.000 | 0.000 |
1.000 1.000 | 1.000 |
||||||||
| Plot | Lyso | Other | |||||||||||
| Expt D |
2 peptides |
2 spectra |
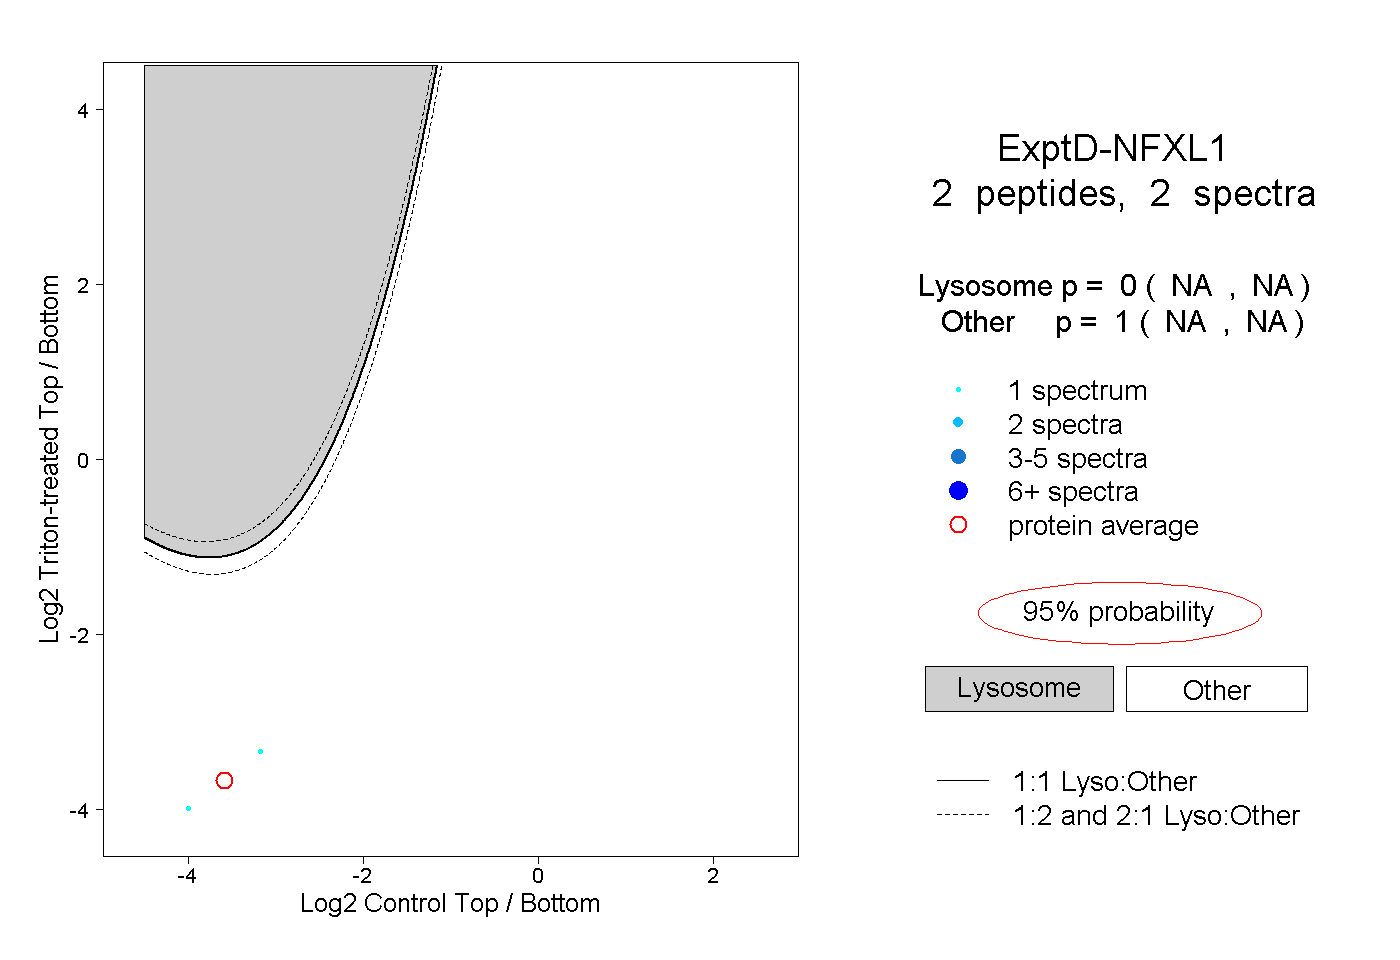 |
0.000 NA | NA |
1.000 NA | NA |