 4
4peptides
spectra
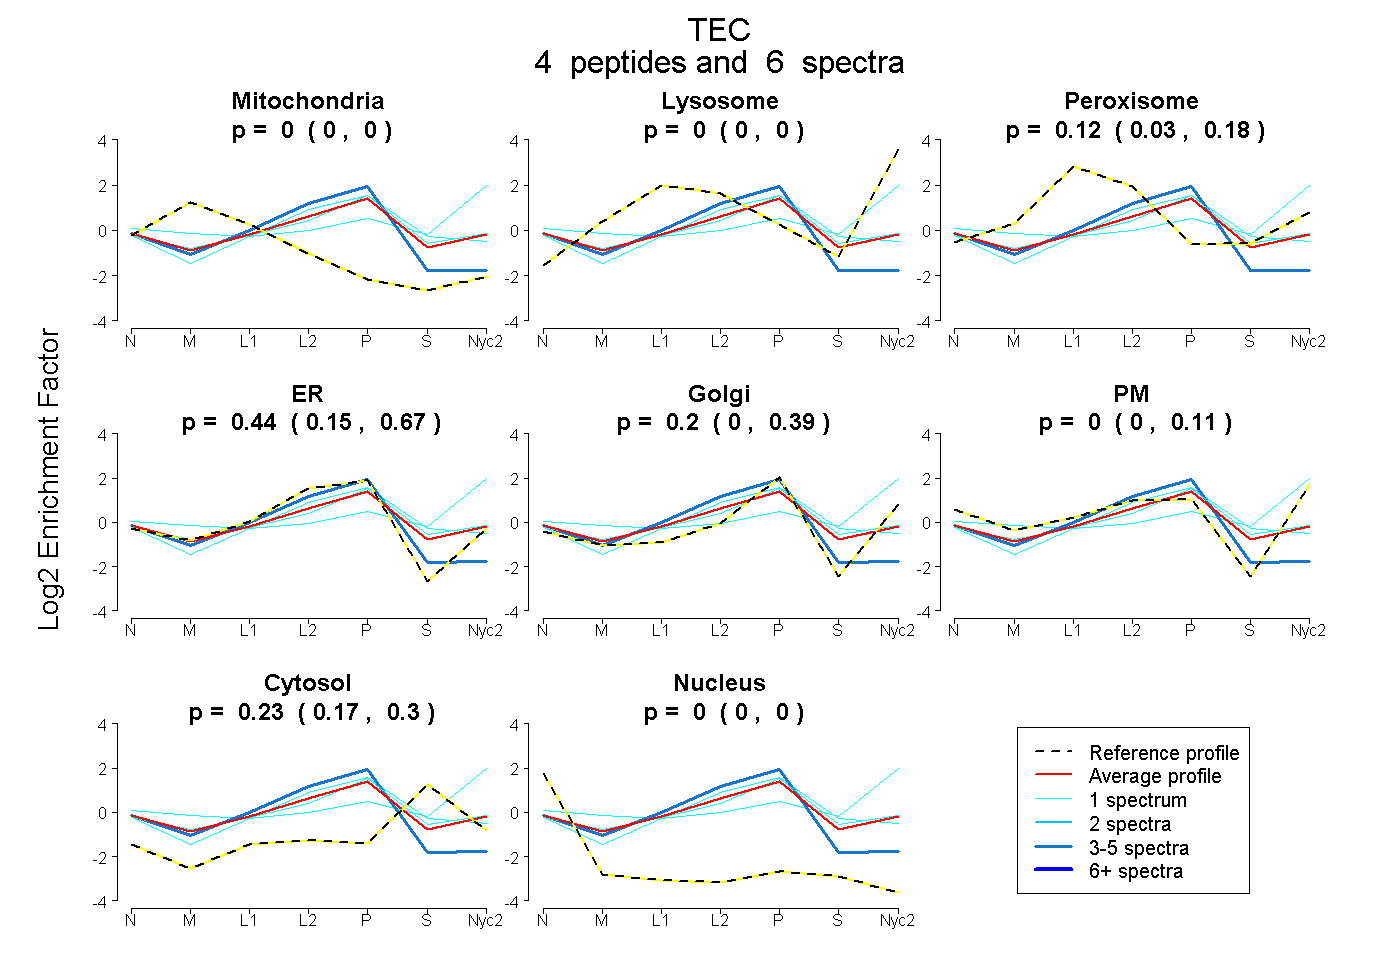
0.000 | 0.000
0.000 | 0.000
0.028 | 0.179
0.152 | 0.666
0.000 | 0.390
0.000 | 0.113
0.172 | 0.296
0.000 | 0.000
| Plot | Mito | Lyso | Perox | ER | Golgi | PM | Cytosol | Nucleus | |||||
| Expt A |
4 peptides |
6 spectra |
|
0.000 0.000 | 0.000 |
0.000 0.000 | 0.000 |
0.122 0.028 | 0.179 |
0.444 0.152 | 0.666 |
0.200 0.000 | 0.390 |
0.000 0.000 | 0.113 |
0.234 0.172 | 0.296 |
0.000 0.000 | 0.000 |
| 1 spectrum, DSSQPGLYTVSLYTK | 0.000 | 0.249 | 0.000 | 0.000 | 0.000 | 0.456 | 0.296 | 0.000 | ||
| 1 spectrum, YNLFESSIR | 0.000 | 0.000 | 0.130 | 0.330 | 0.301 | 0.000 | 0.238 | 0.000 | ||
| 1 spectrum, ELGSGLFGVVR | 0.000 | 0.000 | 0.036 | 0.632 | 0.000 | 0.000 | 0.331 | 0.000 | ||
| 3 spectra, GCLLNFLR | 0.000 | 0.000 | 0.000 | 0.855 | 0.000 | 0.000 | 0.080 | 0.065 |
| Plot | Lyso | Other | |||||||||||
| Expt C |
5 peptides |
7 spectra |
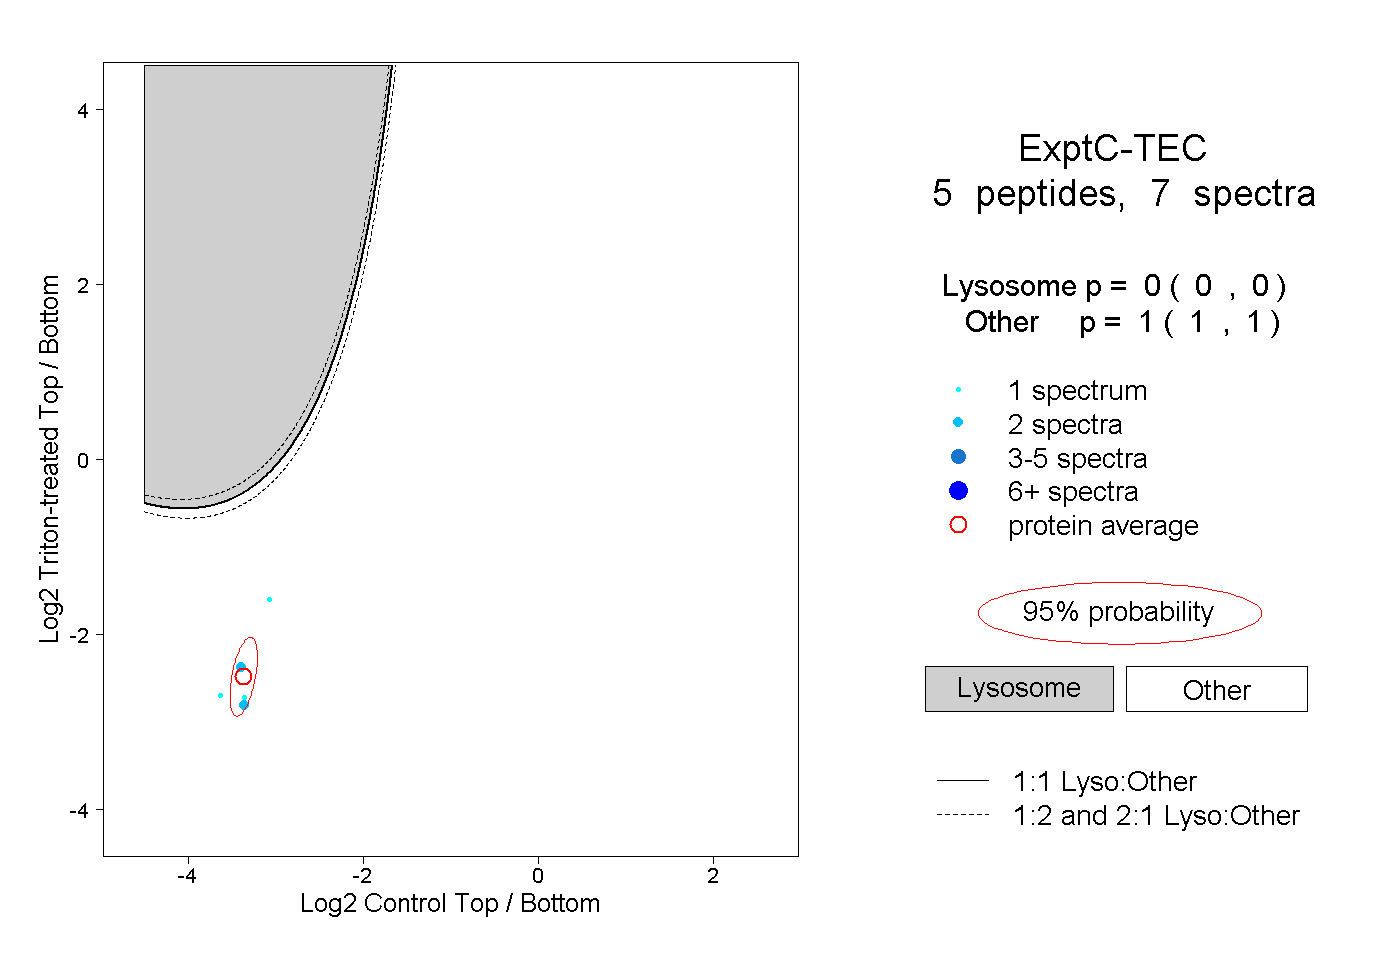 |
0.000 0.000 | 0.000 |
1.000 1.000 | 1.000 |