 13
13peptides
spectra
0.000 | 0.000
1.000 | 1.000
0.000 | 0.000
0.000 | 0.000
0.000 | 0.000
0.000 | 0.000
0.000 | 0.000
0.000 | 0.000
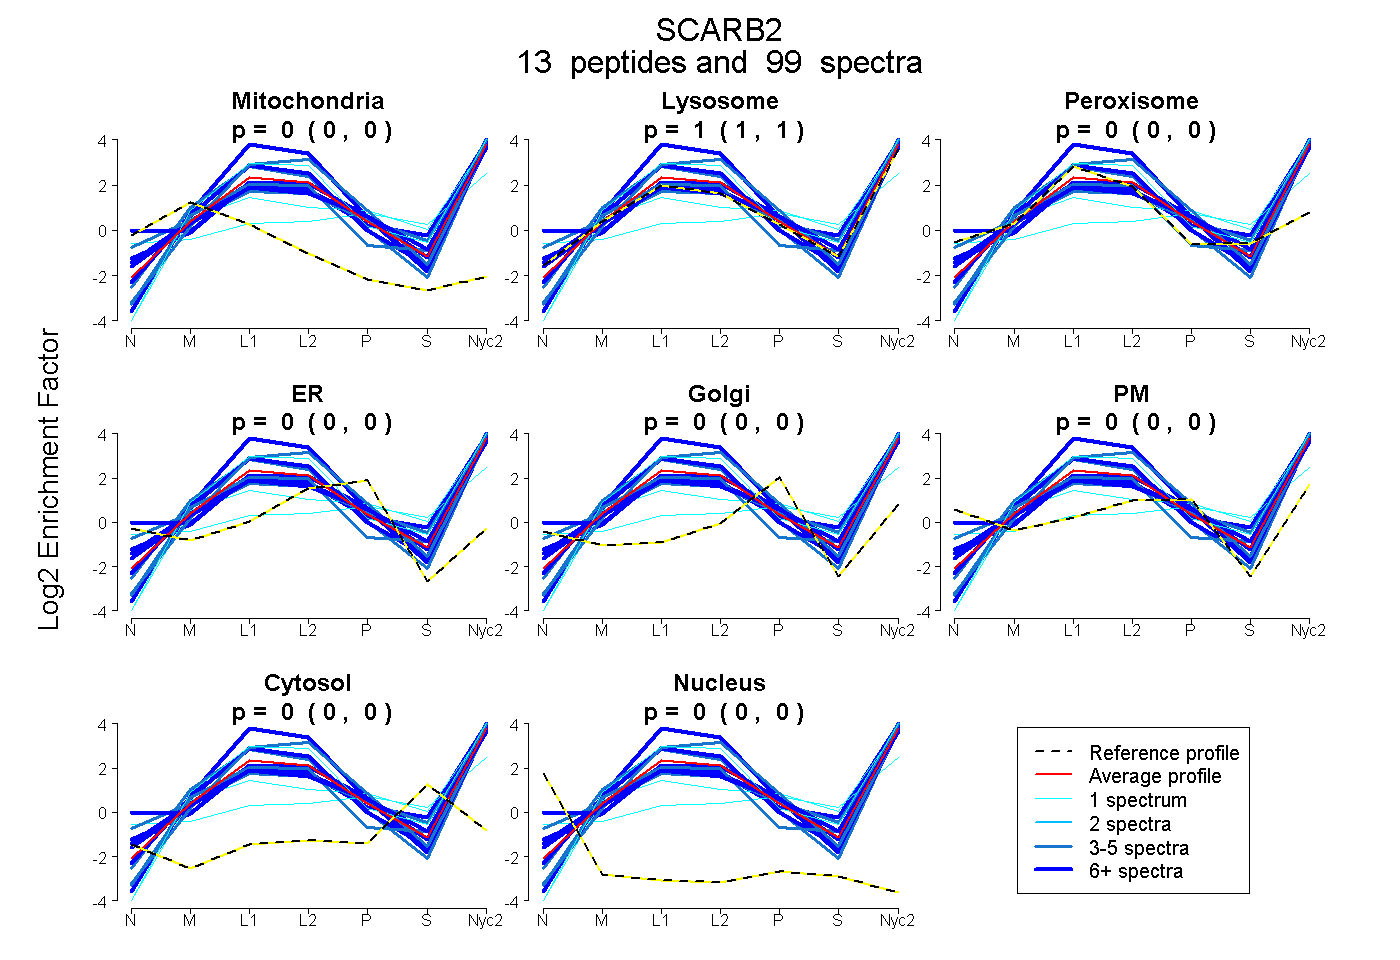
| Plot | Mito | Lyso | Perox | ER | Golgi | PM | Cytosol | Nucleus | |||||
| Expt A |
13 peptides |
99 spectra |
|
0.000 0.000 | 0.000 |
1.000 1.000 | 1.000 |
0.000 0.000 | 0.000 |
0.000 0.000 | 0.000 |
0.000 0.000 | 0.000 |
0.000 0.000 | 0.000 |
0.000 0.000 | 0.000 |
0.000 0.000 | 0.000 |
| 21 spectra, APLIR | 0.000 | 1.000 | 0.000 | 0.000 | 0.000 | 0.000 | 0.000 | 0.000 | ||
| 3 spectra, FQINTYVK | 0.000 | 0.912 | 0.013 | 0.000 | 0.000 | 0.060 | 0.015 | 0.000 | ||
| 1 spectrum, NQSVGDPTVDLIR | 0.000 | 1.000 | 0.000 | 0.000 | 0.000 | 0.000 | 0.000 | 0.000 | ||
| 1 spectrum, EEHESFVDINPLTGIILR | 0.000 | 0.534 | 0.000 | 0.000 | 0.084 | 0.112 | 0.270 | 0.000 | ||
| 6 spectra, DETLYIFPSDFCR | 0.000 | 1.000 | 0.000 | 0.000 | 0.000 | 0.000 | 0.000 | 0.000 | ||
| 25 spectra, AYIFER | 0.000 | 0.981 | 0.000 | 0.000 | 0.000 | 0.000 | 0.019 | 0.000 | ||
| 5 spectra, AVDQTIEK | 0.000 | 1.000 | 0.000 | 0.000 | 0.000 | 0.000 | 0.000 | 0.000 | ||
| 3 spectra, LDDFVETGNIR | 0.000 | 1.000 | 0.000 | 0.000 | 0.000 | 0.000 | 0.000 | 0.000 | ||
| 5 spectra, IVEWNGK | 0.000 | 1.000 | 0.000 | 0.000 | 0.000 | 0.000 | 0.000 | 0.000 | ||
| 14 spectra, FVSAIK | 0.000 | 0.819 | 0.000 | 0.000 | 0.000 | 0.181 | 0.000 | 0.000 | ||
| 7 spectra, NGAPIIMSFPHFYQADEK | 0.000 | 0.994 | 0.000 | 0.000 | 0.005 | 0.000 | 0.001 | 0.000 | ||
| 7 spectra, EIIEAMLK | 0.000 | 0.958 | 0.000 | 0.000 | 0.000 | 0.042 | 0.000 | 0.000 | ||
| 1 spectrum, ETASQLK | 0.000 | 0.937 | 0.000 | 0.000 | 0.000 | 0.000 | 0.063 | 0.000 |
| Plot | Mito | Lyso or Perox | ER | Golgi | PM | Cytosol | Nucleus | ||||||
| Expt B |
9 peptides |
38 spectra |
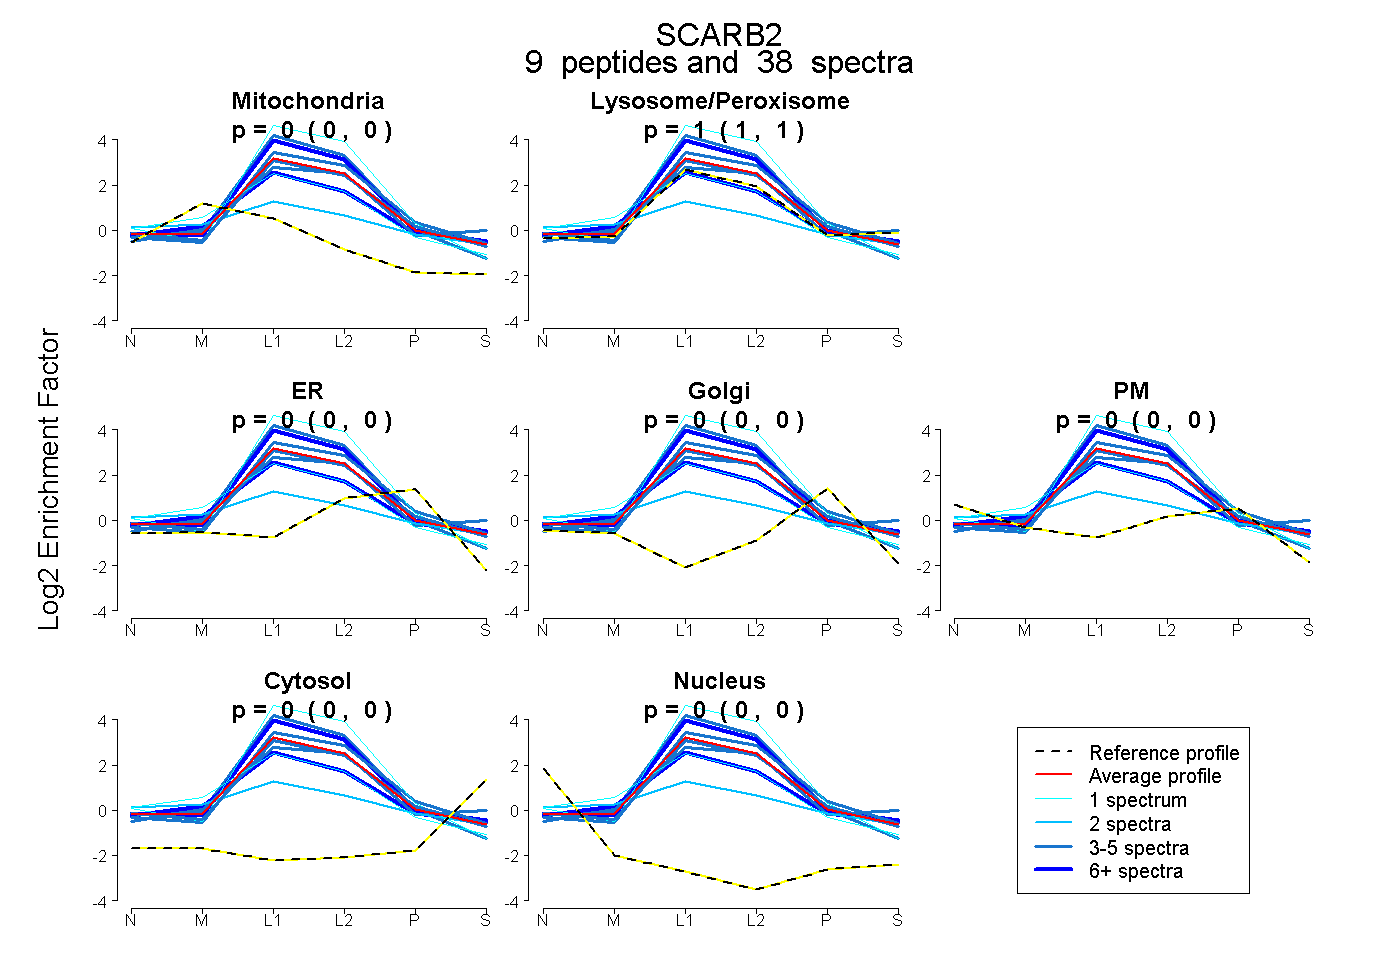 |
0.000 0.000 | 0.000 |
1.000 1.000 | 1.000 |
0.000 0.000 | 0.000 |
0.000 0.000 | 0.000 |
0.000 0.000 | 0.000 |
0.000 0.000 | 0.000 |
0.000 0.000 | 0.000 |
|||
| Plot | Lyso | Other | |||||||||||
| Expt C |
15 peptides |
573 spectra |
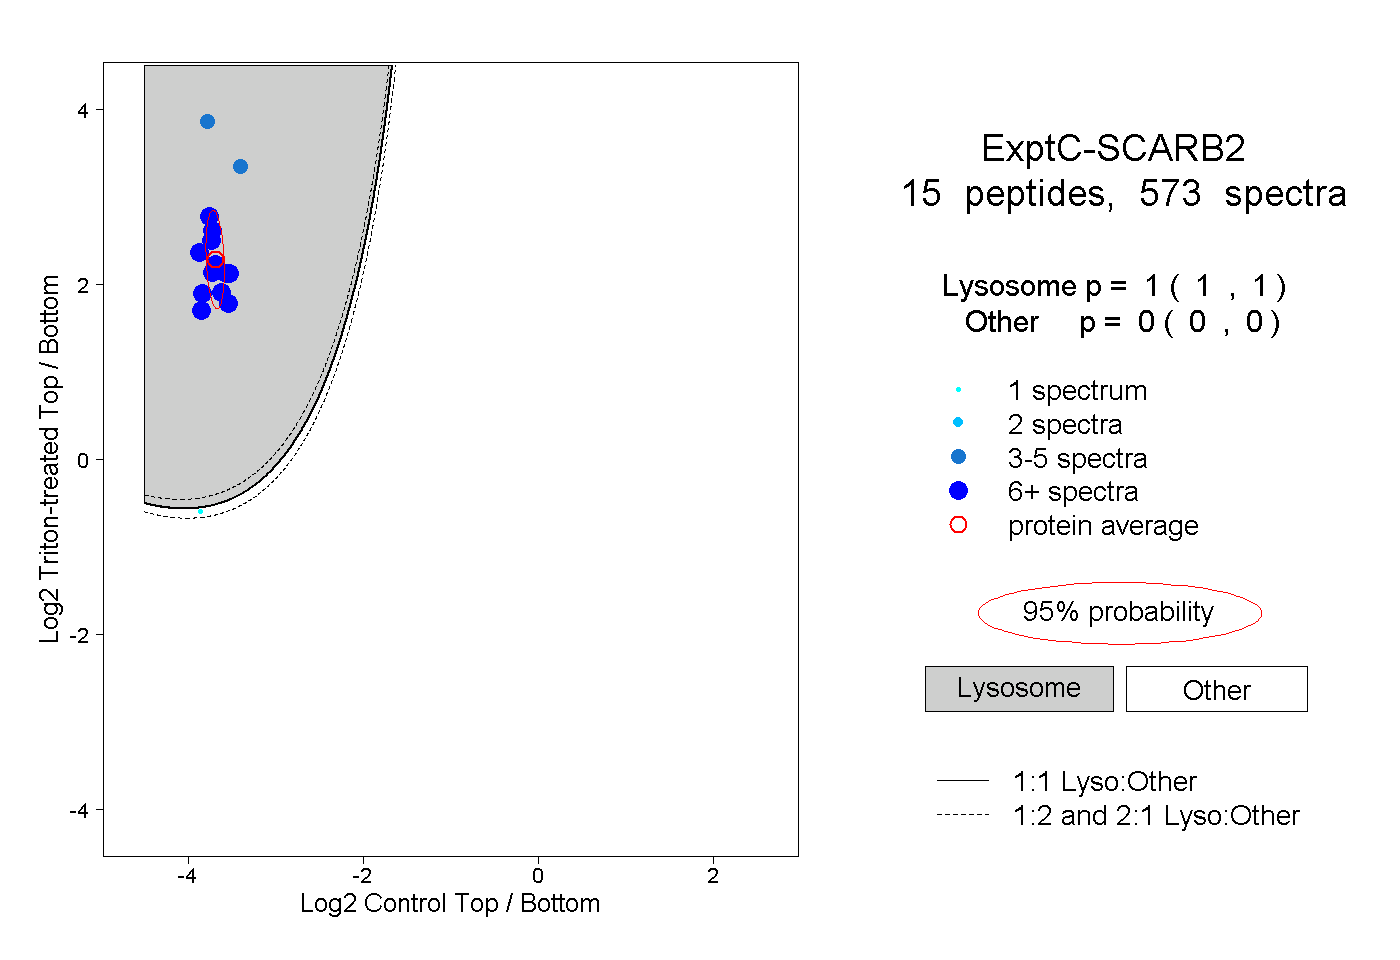 |
1.000 1.000 | 1.000 |
0.000 0.000 | 0.000 |
||||||||
| Plot | Lyso | Other | |||||||||||
| Expt D |
7 peptides |
44 spectra |
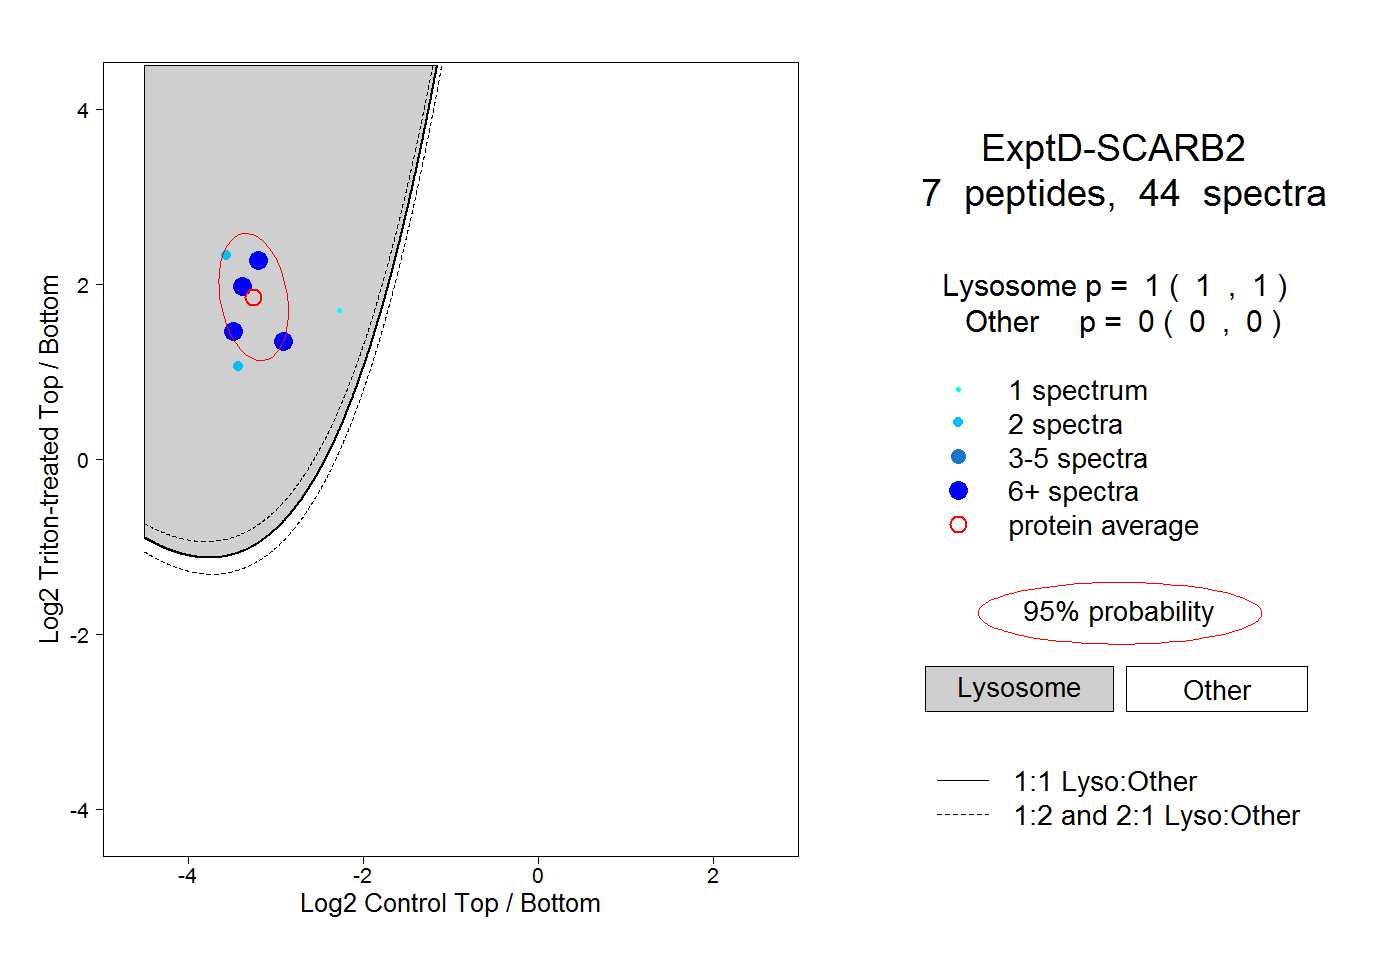 |
1.000 1.000 | 1.000 |
0.000 0.000 | 0.000 |