14
14peptides
spectra
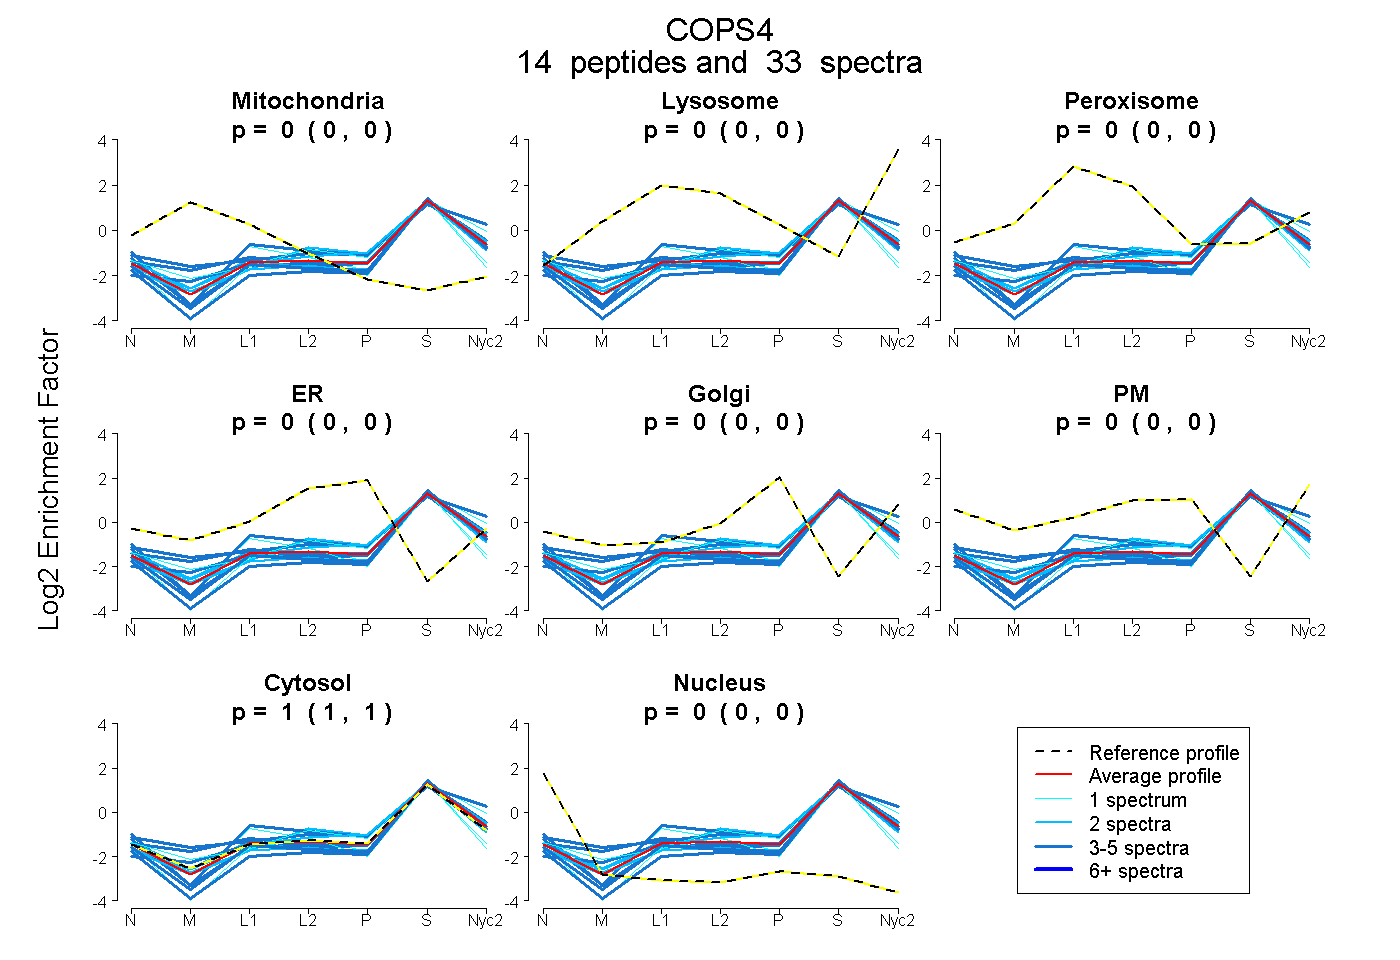
0.000 | 0.000
0.000 | 0.000
0.000 | 0.000
0.000 | 0.000
0.000 | 0.000
0.000 | 0.000
1.000 | 1.000
0.000 | 0.000
5peptides
spectra
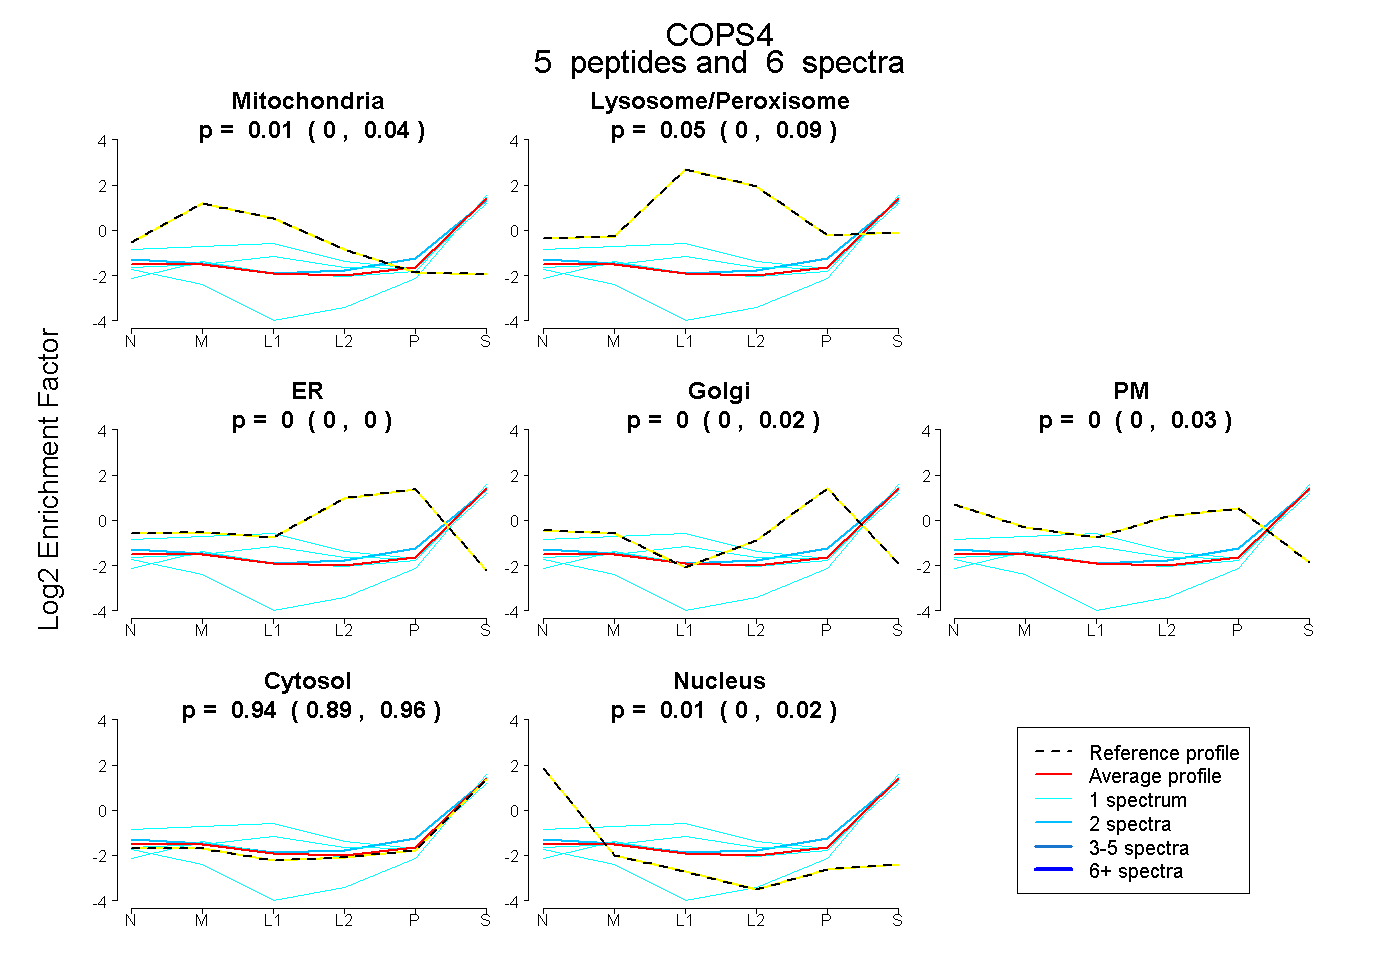
0.000 | 0.042
0.000 | 0.088
0.000 | 0.000
0.000 | 0.016
0.000 | 0.034
0.890 | 0.965
0.000 | 0.024