 14
14peptides
spectra
0.000 | 0.000
0.000 | 0.000
0.000 | 0.000
0.000 | 0.000
0.000 | 0.000
0.000 | 0.000
1.000 | 1.000
0.000 | 0.000
| Plot | Mito | Lyso | Perox | ER | Golgi | PM | Cytosol | Nucleus | |||||
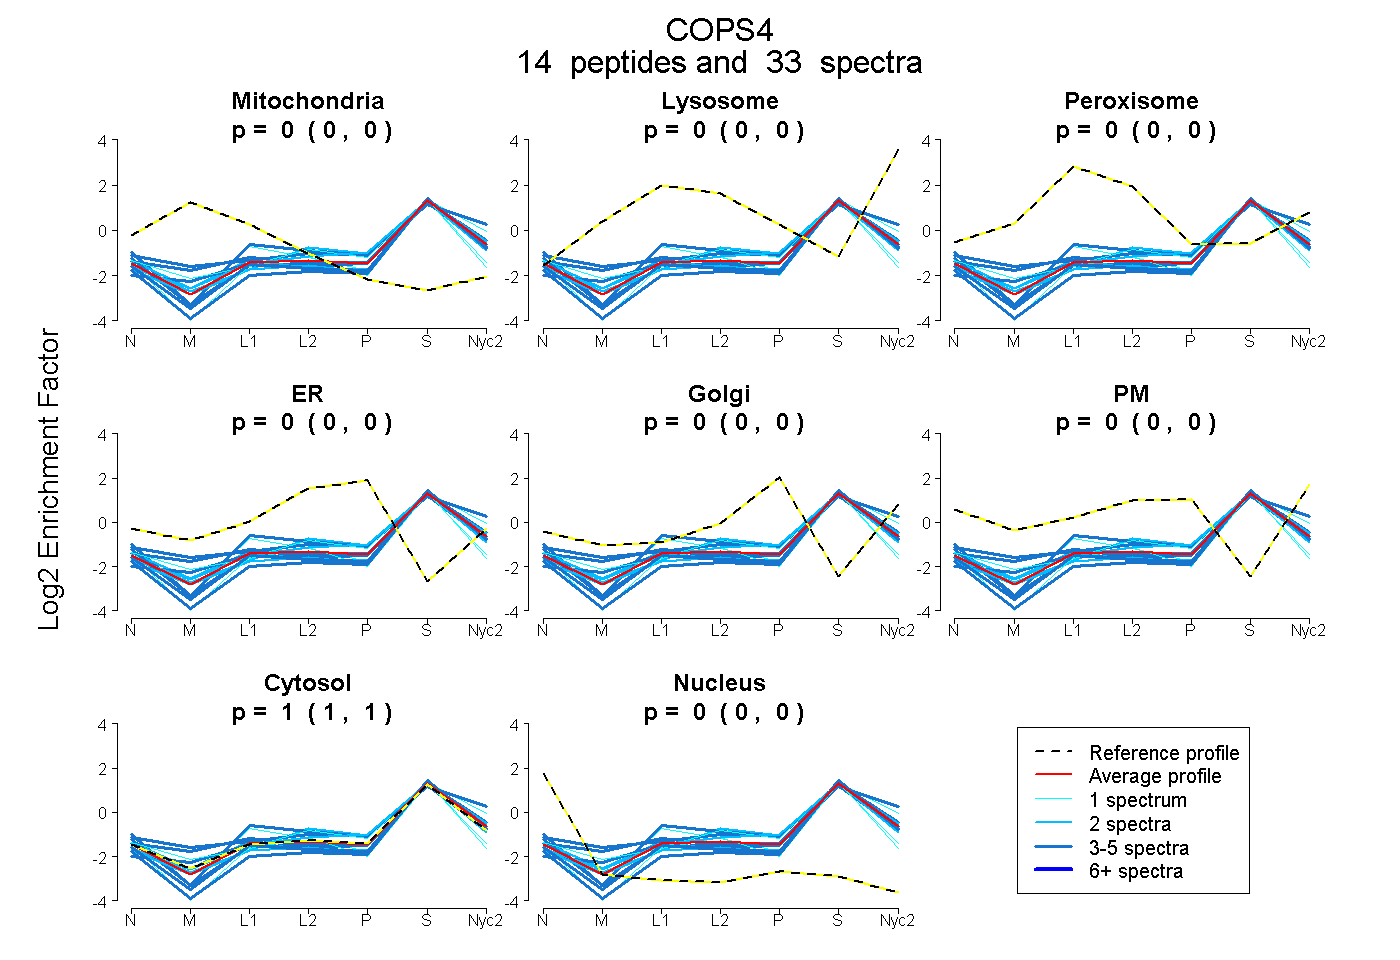
| Expt A |
14 peptides |
33 spectra |
|
0.000 0.000 | 0.000 |
0.000 0.000 | 0.000 |
0.000 0.000 | 0.000 |
0.000 0.000 | 0.000 |
0.000 0.000 | 0.000 |
0.000 0.000 | 0.000 |
1.000 1.000 | 1.000 |
0.000 0.000 | 0.000 |
| 2 spectra, QYNVDYK | 0.000 | 0.021 | 0.000 | 0.000 | 0.029 | 0.000 | 0.950 | 0.000 | ||
| 3 spectra, YNELSYK | 0.000 | 0.000 | 0.000 | 0.000 | 0.000 | 0.000 | 1.000 | 0.000 | ||
| 1 spectrum, QLLTDFCTHLPNLPDSTAK | 0.048 | 0.000 | 0.000 | 0.000 | 0.000 | 0.000 | 0.918 | 0.034 | ||
| 2 spectra, AVIEHNLLSASK | 0.000 | 0.005 | 0.000 | 0.026 | 0.011 | 0.000 | 0.958 | 0.000 | ||
| 3 spectra, IASQMITEGR | 0.000 | 0.148 | 0.000 | 0.000 | 0.000 | 0.026 | 0.826 | 0.000 | ||
| 4 spectra, VISFEEQVASIR | 0.000 | 0.000 | 0.000 | 0.000 | 0.000 | 0.000 | 0.976 | 0.024 | ||
| 3 spectra, GNQLQEFAAMLMPHQK | 0.000 | 0.000 | 0.000 | 0.000 | 0.000 | 0.000 | 1.000 | 0.000 | ||
| 3 spectra, EALPTWDK | 0.049 | 0.057 | 0.000 | 0.000 | 0.000 | 0.000 | 0.894 | 0.000 | ||
| 2 spectra, EVYHFTLEK | 0.000 | 0.000 | 0.000 | 0.000 | 0.000 | 0.000 | 0.969 | 0.031 | ||
| 3 spectra, ATTADGSSILDR | 0.000 | 0.000 | 0.000 | 0.000 | 0.000 | 0.000 | 0.948 | 0.052 | ||
| 1 spectrum, AIQLSGTEQLEALK | 0.000 | 0.057 | 0.000 | 0.000 | 0.000 | 0.000 | 0.943 | 0.000 | ||
| 3 spectra, HALHCTILASAGQQR | 0.000 | 0.003 | 0.078 | 0.000 | 0.000 | 0.000 | 0.919 | 0.000 | ||
| 1 spectrum, QIQSLCFQVNNLLEK | 0.000 | 0.000 | 0.000 | 0.000 | 0.000 | 0.000 | 0.973 | 0.027 | ||
| 2 spectra, LETYIK | 0.000 | 0.000 | 0.000 | 0.000 | 0.000 | 0.000 | 1.000 | 0.000 |
| Plot | Mito | Lyso or Perox | ER | Golgi | PM | Cytosol | Nucleus | ||||||
| Expt B |
5 peptides |
6 spectra |
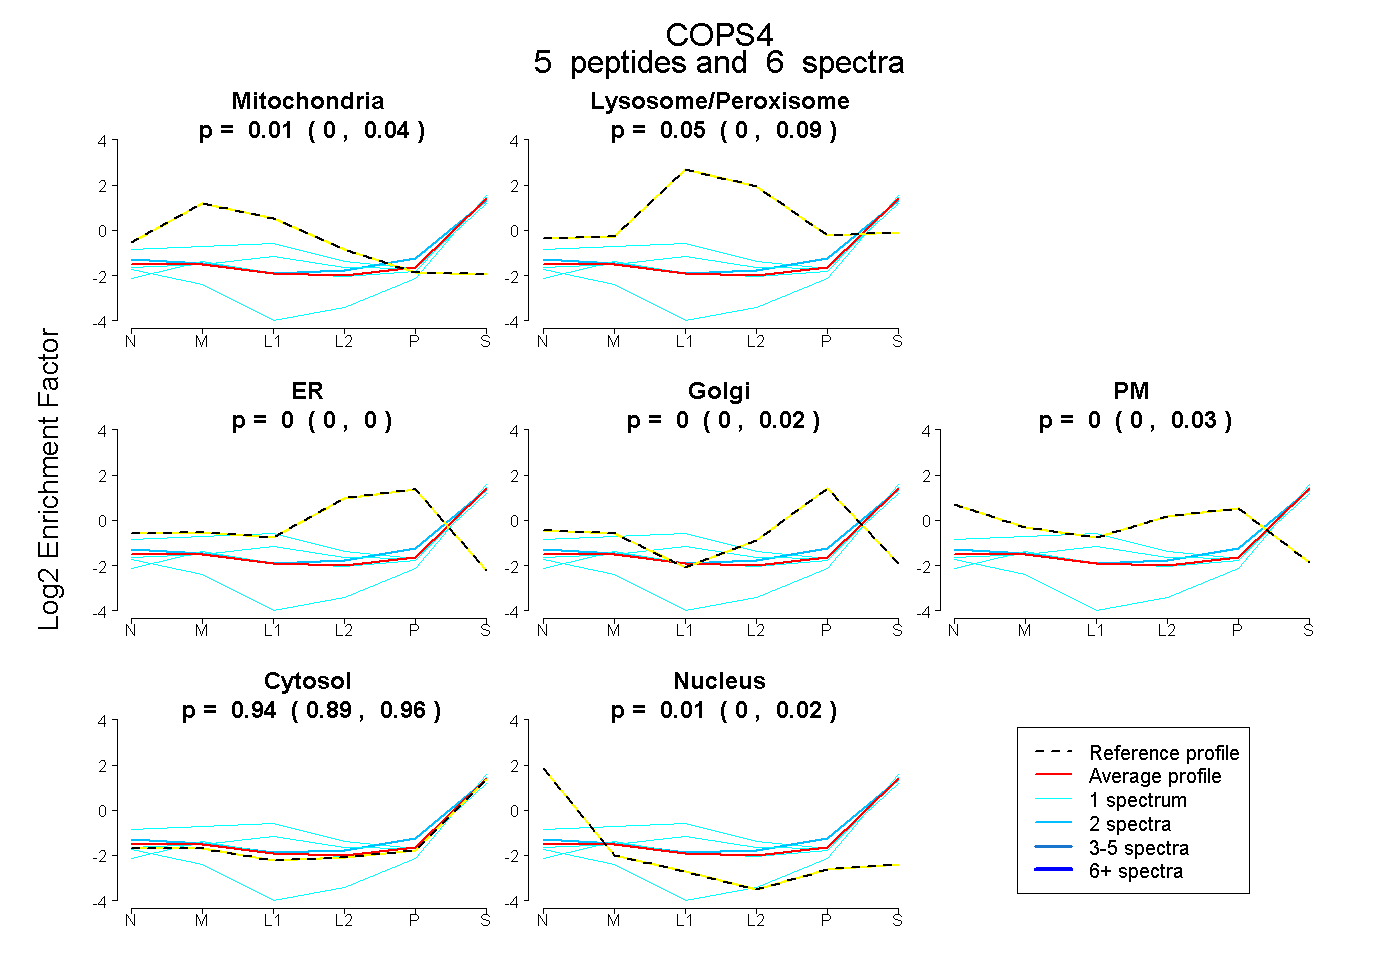 |
0.007 0.000 | 0.042 |
0.049 0.000 | 0.088 |
0.000 0.000 | 0.000 |
0.000 0.000 | 0.016 |
0.000 0.000 | 0.034 |
0.939 0.890 | 0.965 |
0.006 0.000 | 0.024 |
|||
| Plot | Lyso | Other | |||||||||||
| Expt C |
10 peptides |
25 spectra |
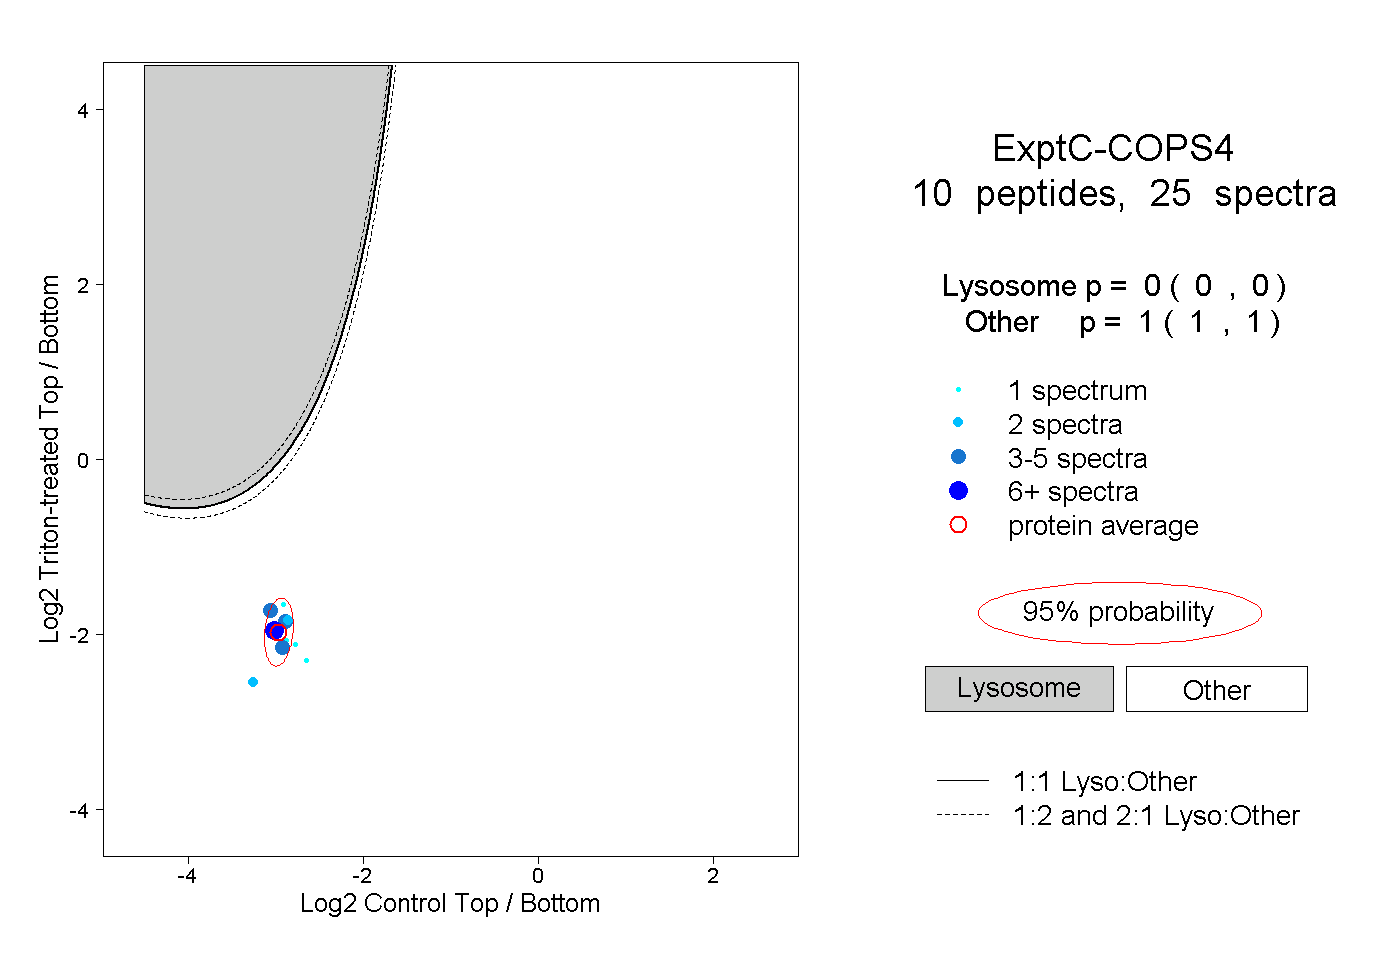 |
0.000 0.000 | 0.000 |
1.000 1.000 | 1.000 |
||||||||
| Plot | Lyso | Other | |||||||||||
| Expt D |
1 peptide |
1 spectrum |
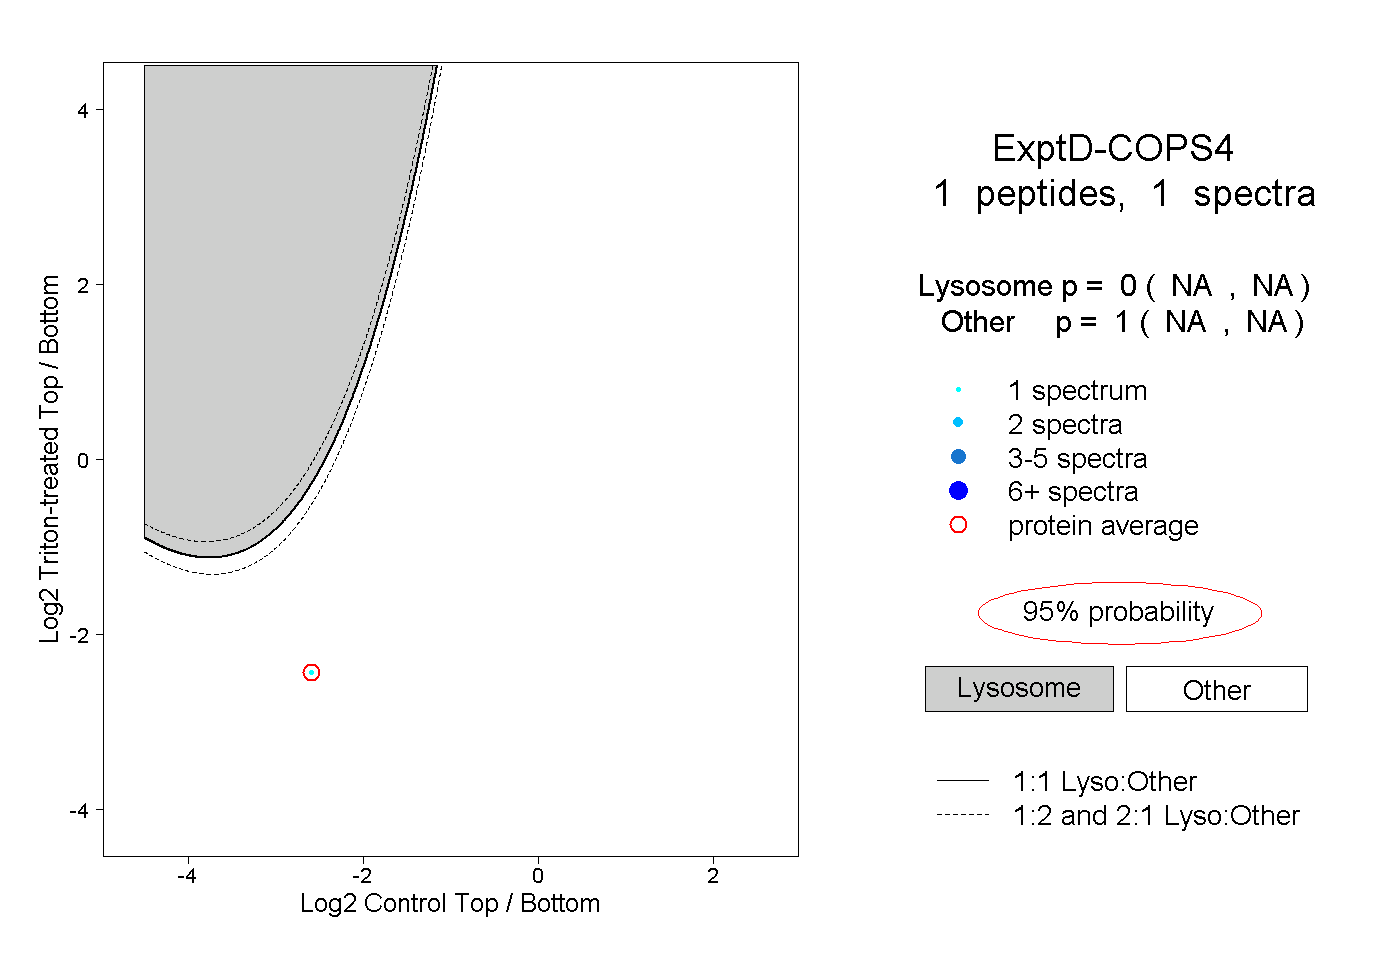 |
0.000 NA | NA |
1.000 NA | NA |