4
4peptides
spectra
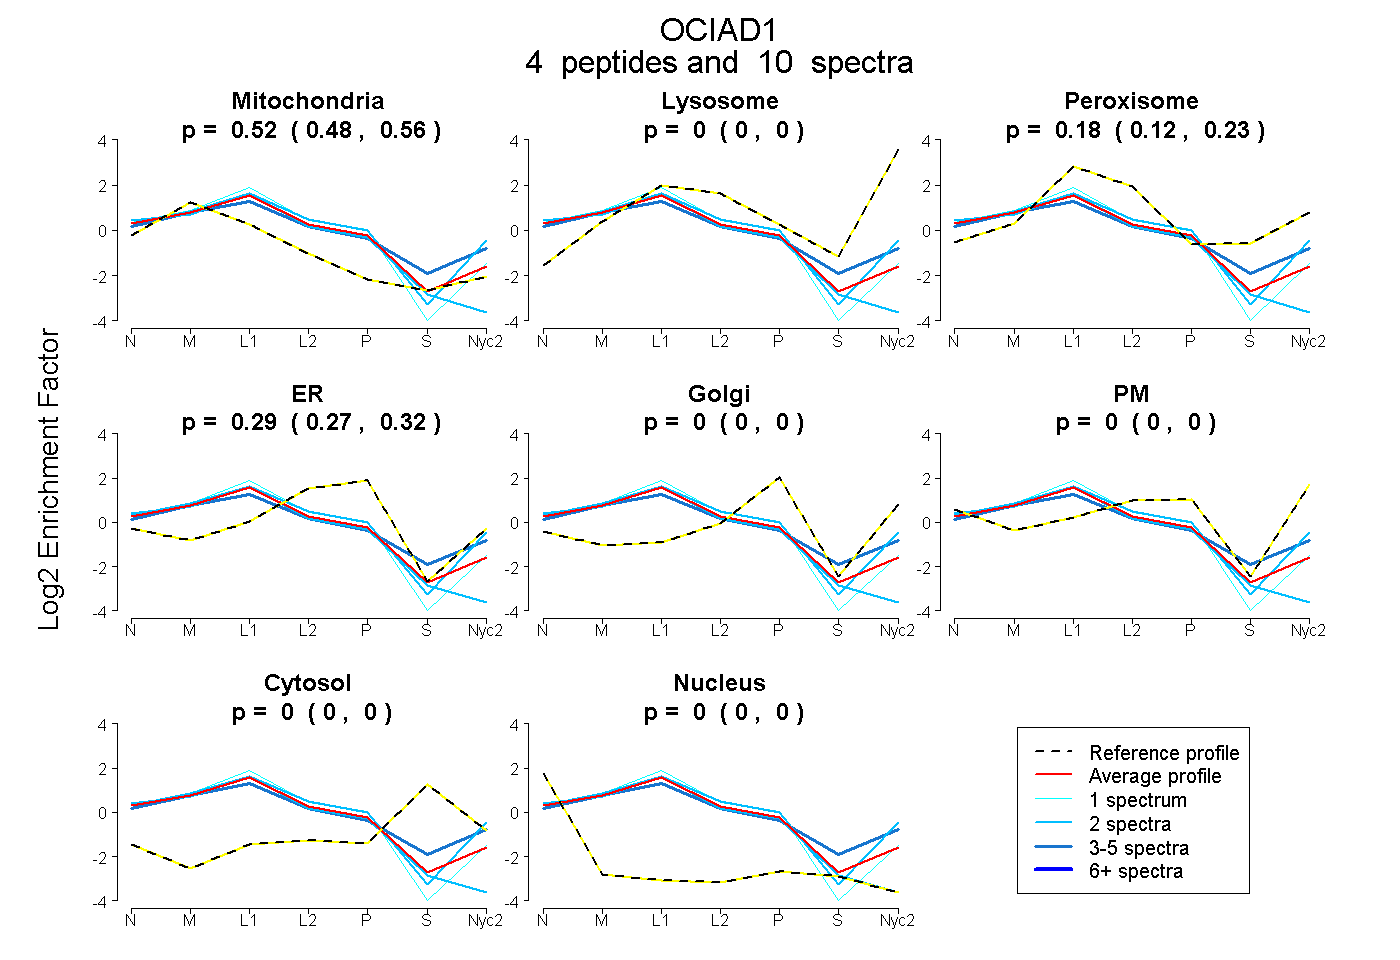
0.484 | 0.558
0.000 | 0.000
0.124 | 0.228
0.266 | 0.319
0.000 | 0.000
0.000 | 0.000
0.000 | 0.000
0.000 | 0.000
6peptides
spectra
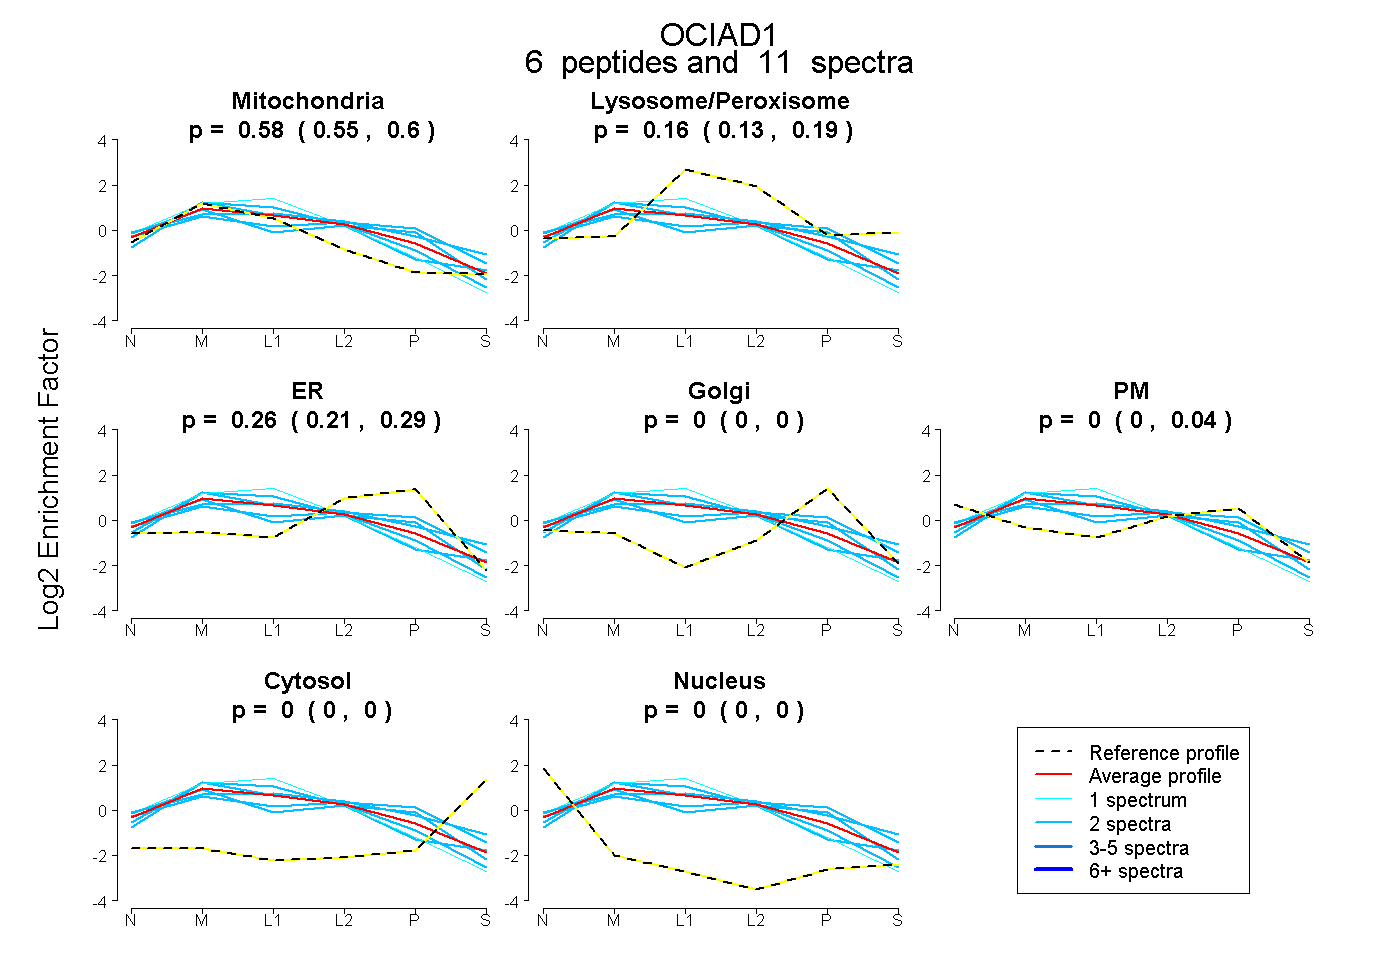
0.548 | 0.603
0.132 | 0.188
0.212 | 0.288
0.000 | 0.000
0.000 | 0.036
0.000 | 0.000
0.000 | 0.000