 4
4peptides
spectra
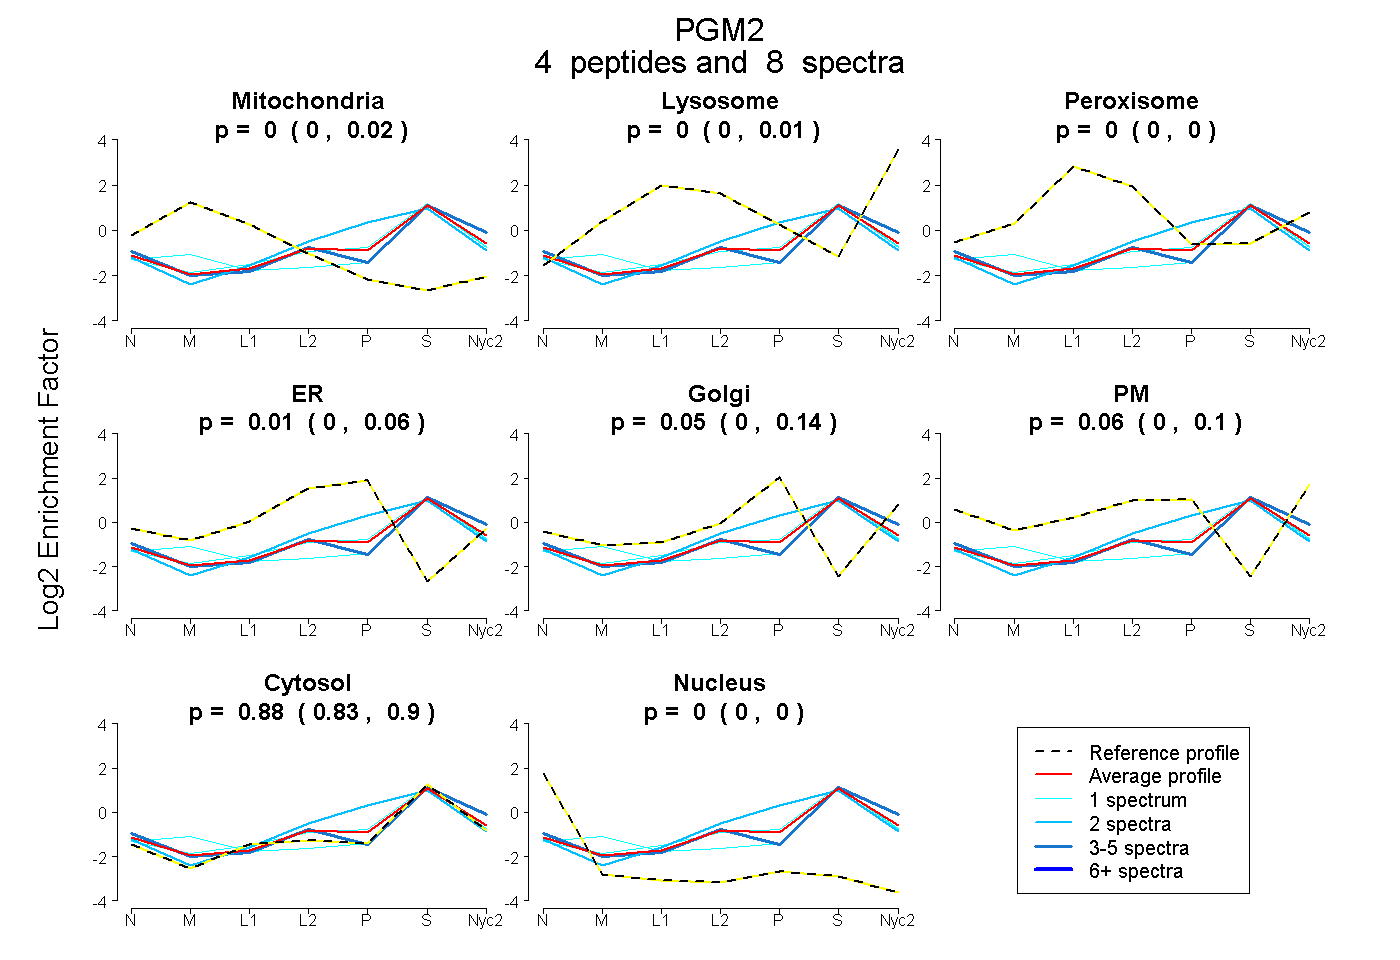
0.000 | 0.019
0.000 | 0.009
0.000 | 0.001
0.000 | 0.064
0.000 | 0.144
0.000 | 0.103
0.832 | 0.904
0.000 | 0.000
6peptides
spectra
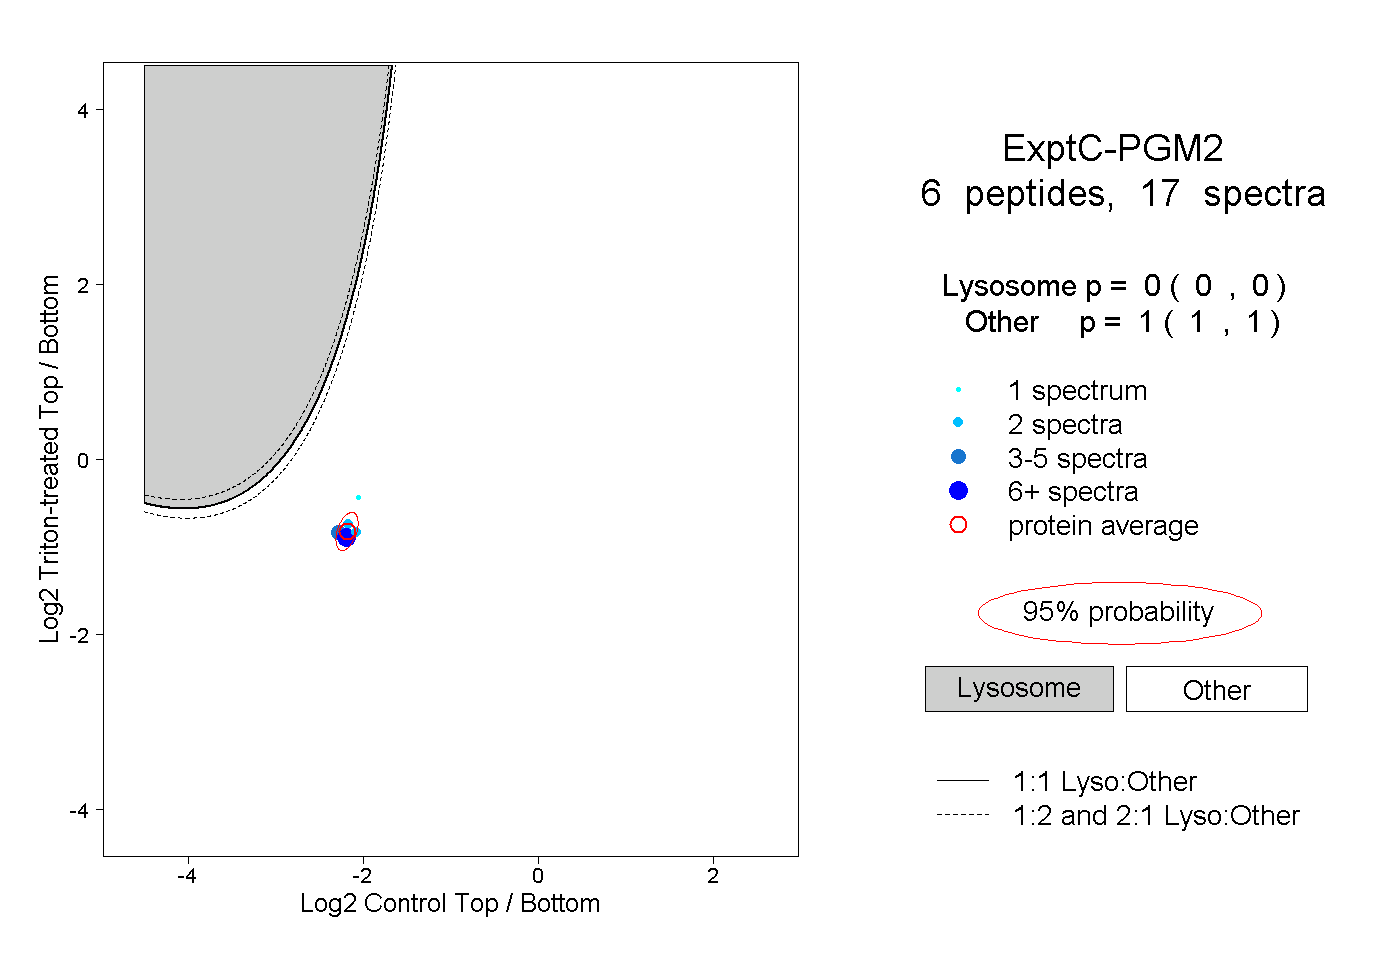
0.000 | 0.000
1.000 | 1.000
| Plot | Mito | Lyso | Perox | ER | Golgi | PM | Cytosol | Nucleus | |||||
| Expt A |
4 peptides |
8 spectra |
|
0.000 0.000 | 0.019 |
0.000 0.000 | 0.009 |
0.000 0.000 | 0.001 |
0.012 0.000 | 0.064 |
0.053 0.000 | 0.144 |
0.060 0.000 | 0.103 |
0.876 0.832 | 0.904 |
0.000 0.000 | 0.000 |
||
| Plot | Lyso | Other | |||||||||||
| Expt C |
6 peptides |
17 spectra |
|
0.000 0.000 | 0.000 |
1.000 1.000 | 1.000 |