 6
6peptides
spectra
0.000 | 0.000
0.033 | 0.062
0.000 | 0.000
0.000 | 0.000
0.000 | 0.000
0.000 | 0.000
0.935 | 0.965
0.000 | 0.000
| Plot | Mito | Lyso | Perox | ER | Golgi | PM | Cytosol | Nucleus | |||||
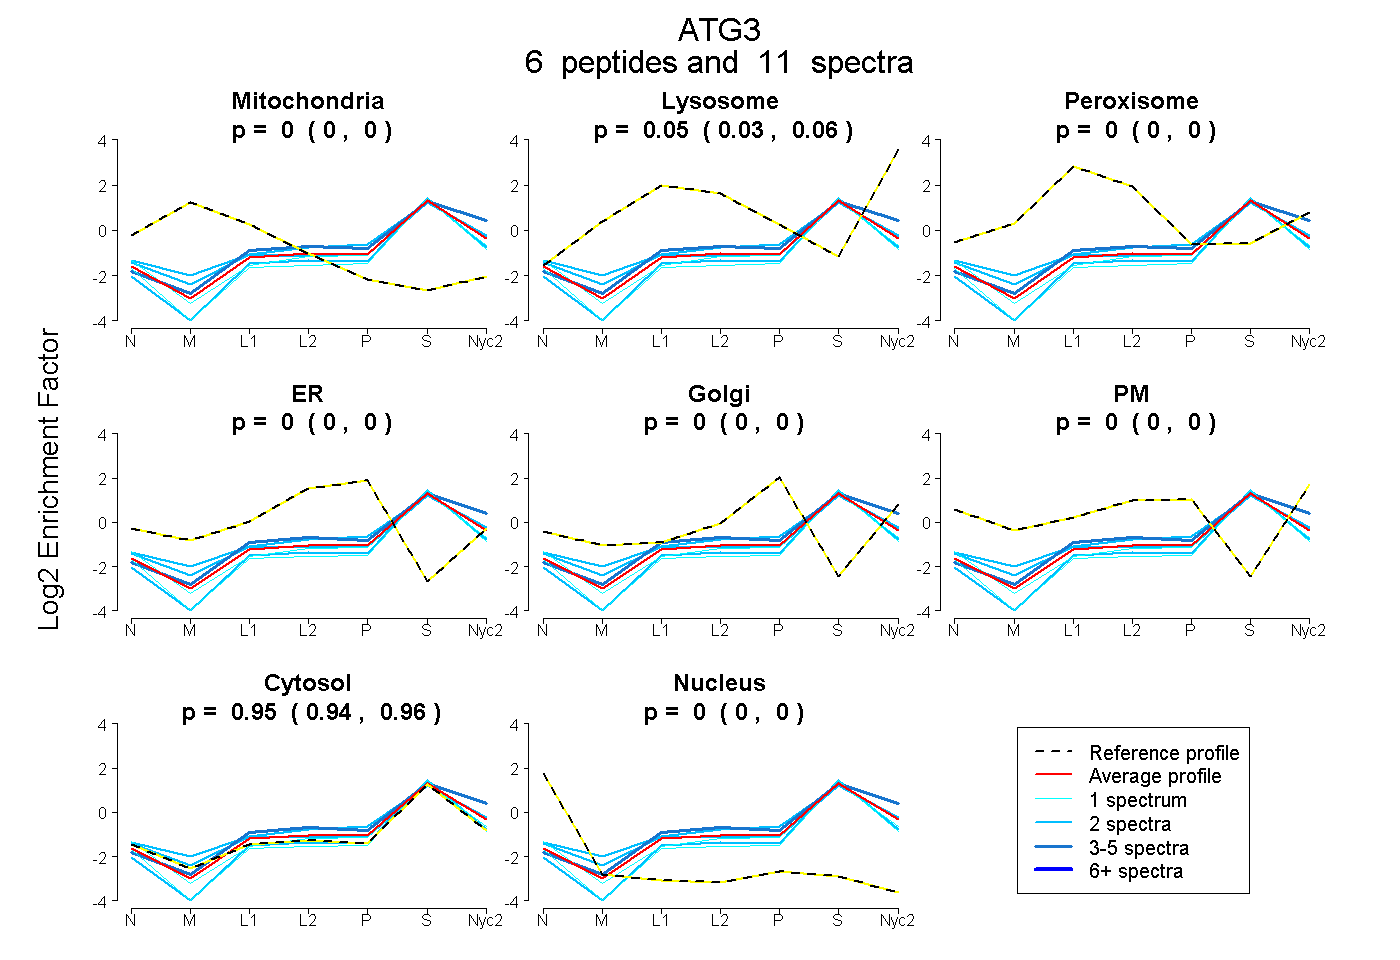
| Expt A |
6 peptides |
11 spectra |
|
0.000 0.000 | 0.000 |
0.049 0.033 | 0.062 |
0.000 0.000 | 0.000 |
0.000 0.000 | 0.000 |
0.000 0.000 | 0.000 |
0.000 0.000 | 0.000 |
0.951 0.935 | 0.965 |
0.000 0.000 | 0.000 |
| 1 spectrum, QFLVTK | 0.000 | 0.000 | 0.000 | 0.000 | 0.005 | 0.000 | 0.995 | 0.000 | ||
| 3 spectra, LWLFGYDEQR | 0.000 | 0.162 | 0.000 | 0.000 | 0.000 | 0.000 | 0.838 | 0.000 | ||
| 2 spectra, HAEVMK | 0.000 | 0.092 | 0.000 | 0.012 | 0.040 | 0.000 | 0.856 | 0.000 | ||
| 2 spectra, ALEVAEYLTPVLK | 0.000 | 0.000 | 0.000 | 0.000 | 0.000 | 0.000 | 1.000 | 0.000 | ||
| 1 spectrum, NVPCYK | 0.000 | 0.000 | 0.000 | 0.000 | 0.000 | 0.000 | 1.000 | 0.000 | ||
| 2 spectra, AYLPTGK | 0.000 | 0.112 | 0.000 | 0.000 | 0.000 | 0.000 | 0.888 | 0.000 |
| Plot | Mito | Lyso or Perox | ER | Golgi | PM | Cytosol | Nucleus | ||||||
| Expt B |
3 peptides |
3 spectra |
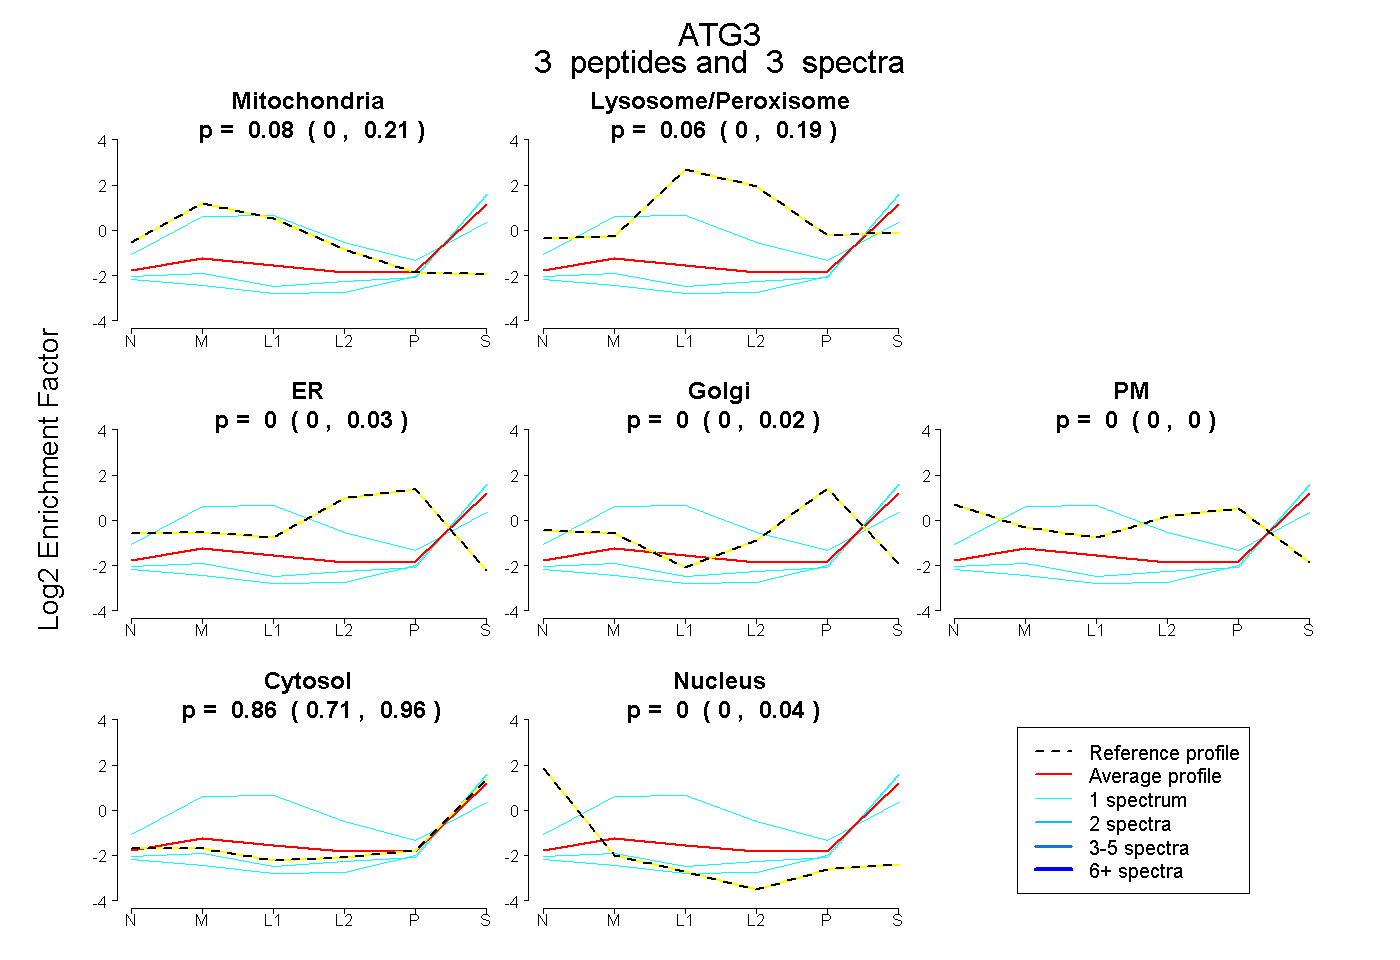 |
0.082 0.000 | 0.213 |
0.055 0.000 | 0.187 |
0.000 0.000 | 0.025 |
0.000 0.000 | 0.018 |
0.000 0.000 | 0.000 |
0.862 0.706 | 0.965 |
0.000 0.000 | 0.039 |
|||
| Plot | Lyso | Other | |||||||||||
| Expt C |
7 peptides |
16 spectra |
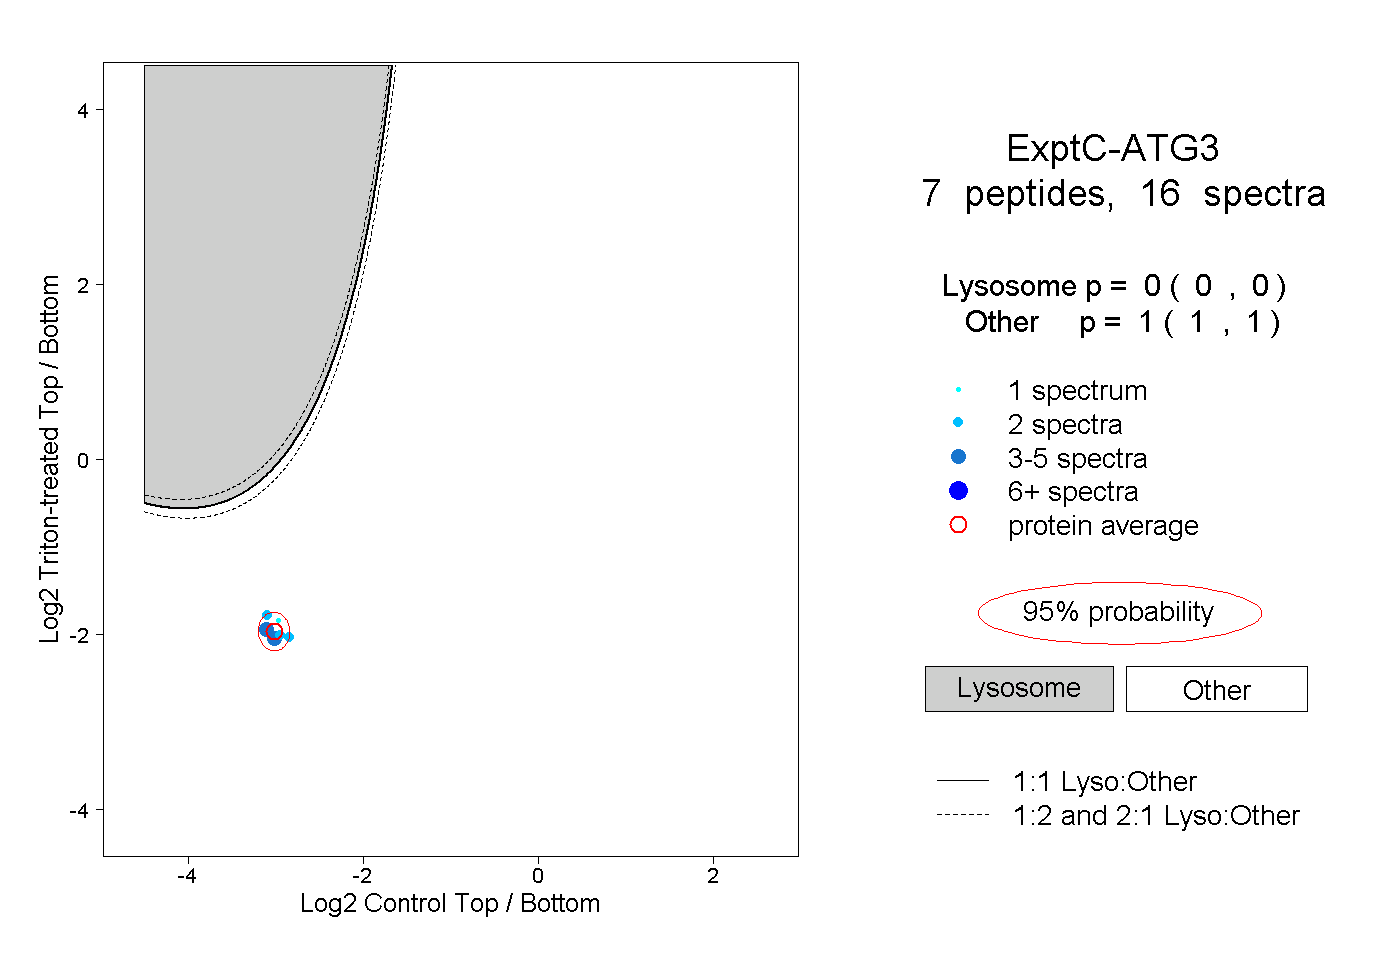 |
0.000 0.000 | 0.000 |
1.000 1.000 | 1.000 |