 4
4peptides
spectra
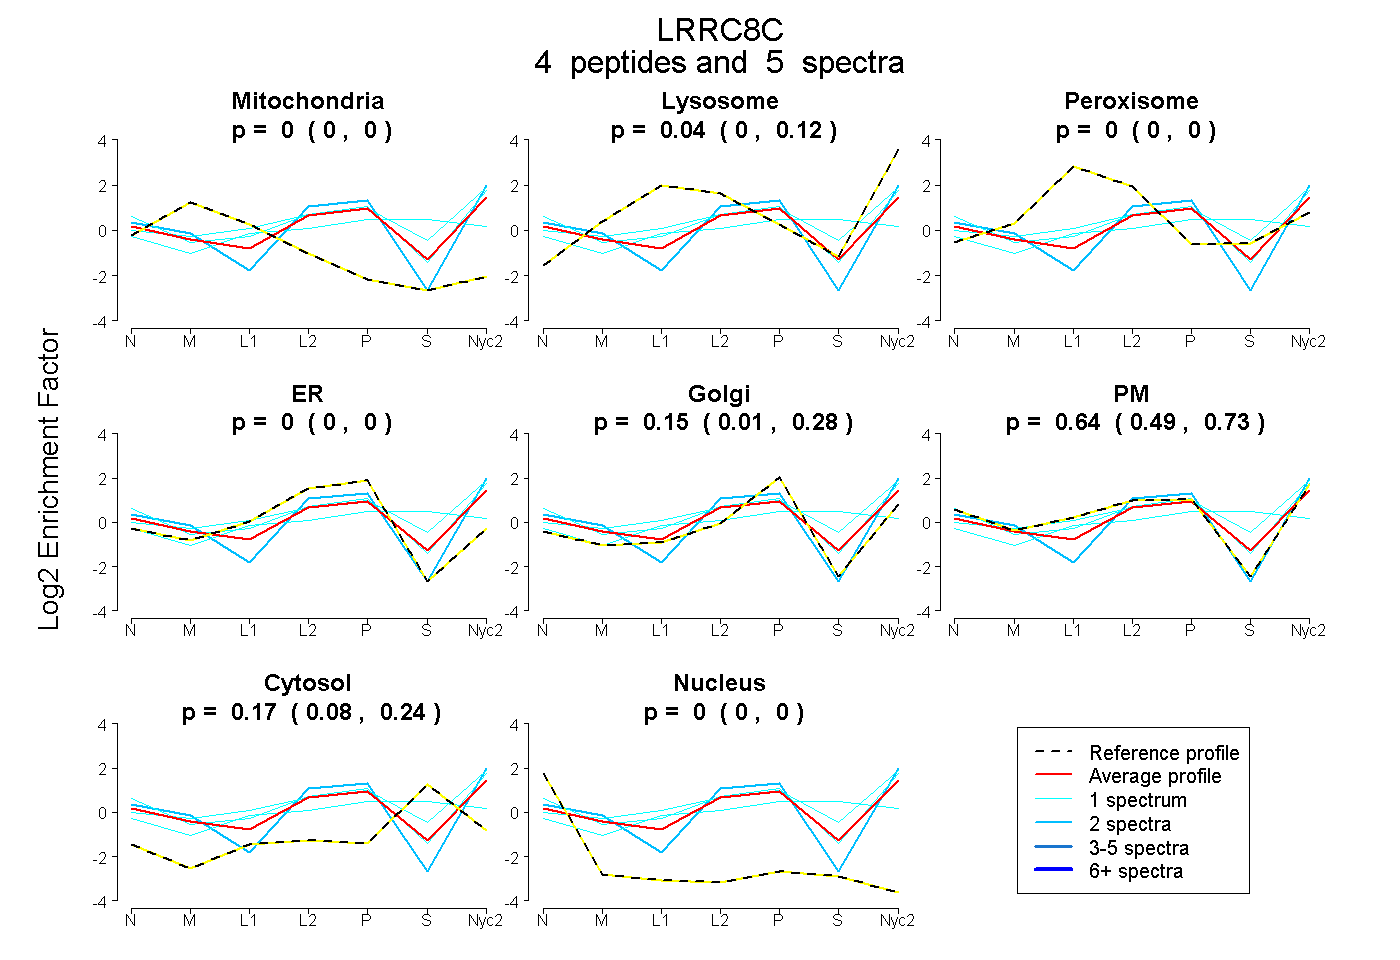
0.000 | 0.000
0.000 | 0.124
0.000 | 0.000
0.000 | 0.000
0.011 | 0.282
0.492 | 0.729
0.077 | 0.236
0.000 | 0.000
| Plot | Mito | Lyso | Perox | ER | Golgi | PM | Cytosol | Nucleus | |||||
| Expt A |
4 peptides |
5 spectra |
|
0.000 0.000 | 0.000 |
0.035 0.000 | 0.124 |
0.000 0.000 | 0.000 |
0.000 0.000 | 0.000 |
0.153 0.011 | 0.282 |
0.640 0.492 | 0.729 |
0.171 0.077 | 0.236 |
0.000 0.000 | 0.000 |
| 1 spectrum, VESLPDELYFCK | 0.000 | 0.000 | 0.262 | 0.000 | 0.244 | 0.070 | 0.424 | 0.000 | ||
| 1 spectrum, QFSEQQPAFR | 0.000 | 0.017 | 0.000 | 0.000 | 0.000 | 0.857 | 0.126 | 0.000 | ||
| 1 spectrum, LFFSHNK | 0.000 | 0.275 | 0.000 | 0.000 | 0.029 | 0.495 | 0.201 | 0.000 | ||
| 2 spectra, IEHFISILGK | 0.000 | 0.000 | 0.000 | 0.000 | 0.397 | 0.603 | 0.000 | 0.000 |
| Plot | Lyso | Other | |||||||||||
| Expt C |
5 peptides |
7 spectra |
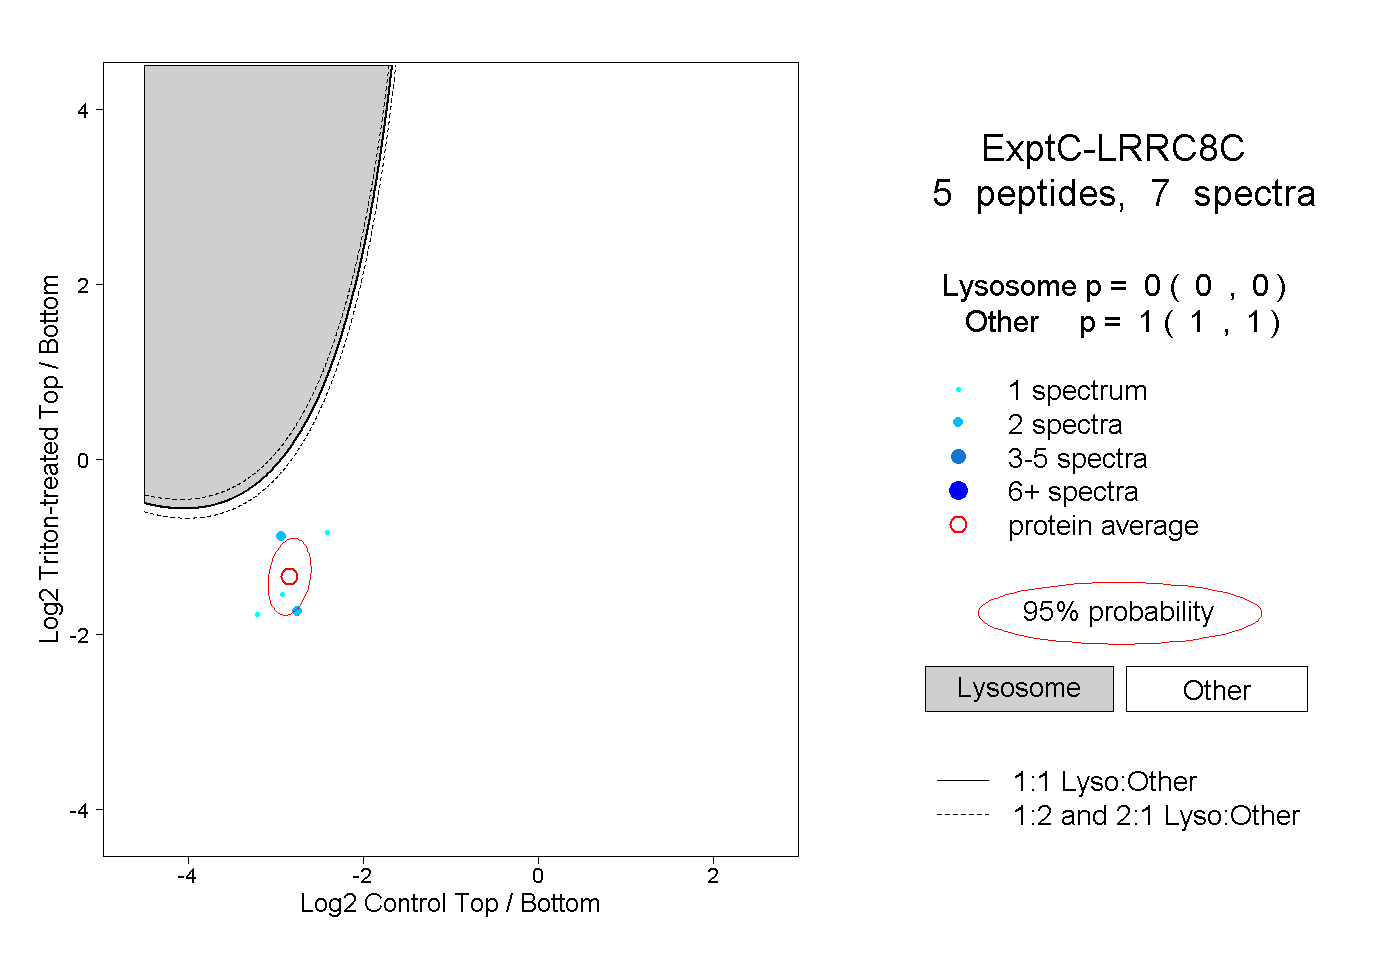 |
0.000 0.000 | 0.000 |
1.000 1.000 | 1.000 |