 5
5peptides
spectra
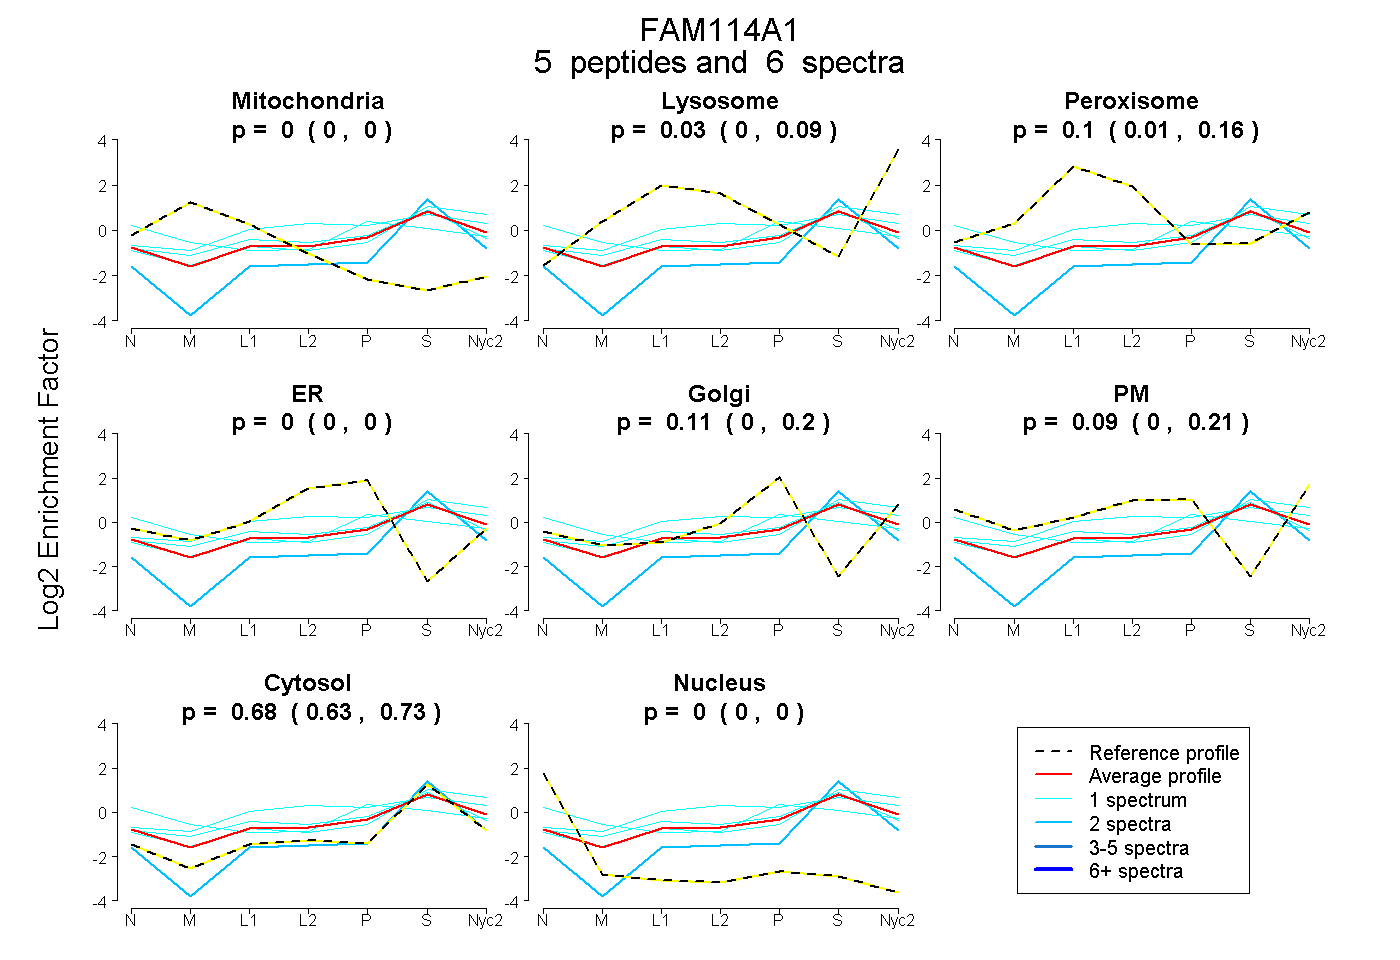
0.000 | 0.002
0.000 | 0.093
0.009 | 0.161
0.000 | 0.000
0.000 | 0.198
0.000 | 0.211
0.628 | 0.726
0.000 | 0.000
| Plot | Mito | Lyso | Perox | ER | Golgi | PM | Cytosol | Nucleus | |||||
| Expt A |
5 peptides |
6 spectra |
|
0.000 0.000 | 0.002 |
0.027 0.000 | 0.093 |
0.100 0.009 | 0.161 |
0.000 0.000 | 0.000 |
0.106 0.000 | 0.198 |
0.086 0.000 | 0.211 |
0.681 0.628 | 0.726 |
0.000 0.000 | 0.000 |
| 1 spectrum, LAQQLTAER | 0.000 | 0.219 | 0.000 | 0.000 | 0.000 | 0.063 | 0.718 | 0.000 | ||
| 1 spectrum, IHSVNSGSPEGALTDAENR | 0.000 | 0.073 | 0.306 | 0.000 | 0.180 | 0.000 | 0.441 | 0.000 | ||
| 2 spectra, DLFVAK | 0.000 | 0.000 | 0.000 | 0.000 | 0.000 | 0.000 | 1.000 | 0.000 | ||
| 1 spectrum, WAGWGSWGK | 0.000 | 0.000 | 0.232 | 0.000 | 0.148 | 0.000 | 0.620 | 0.000 | ||
| 1 spectrum, LTTAMCNEVASLSK | 0.113 | 0.000 | 0.000 | 0.000 | 0.207 | 0.227 | 0.453 | 0.000 |