 1
1peptide
spectra
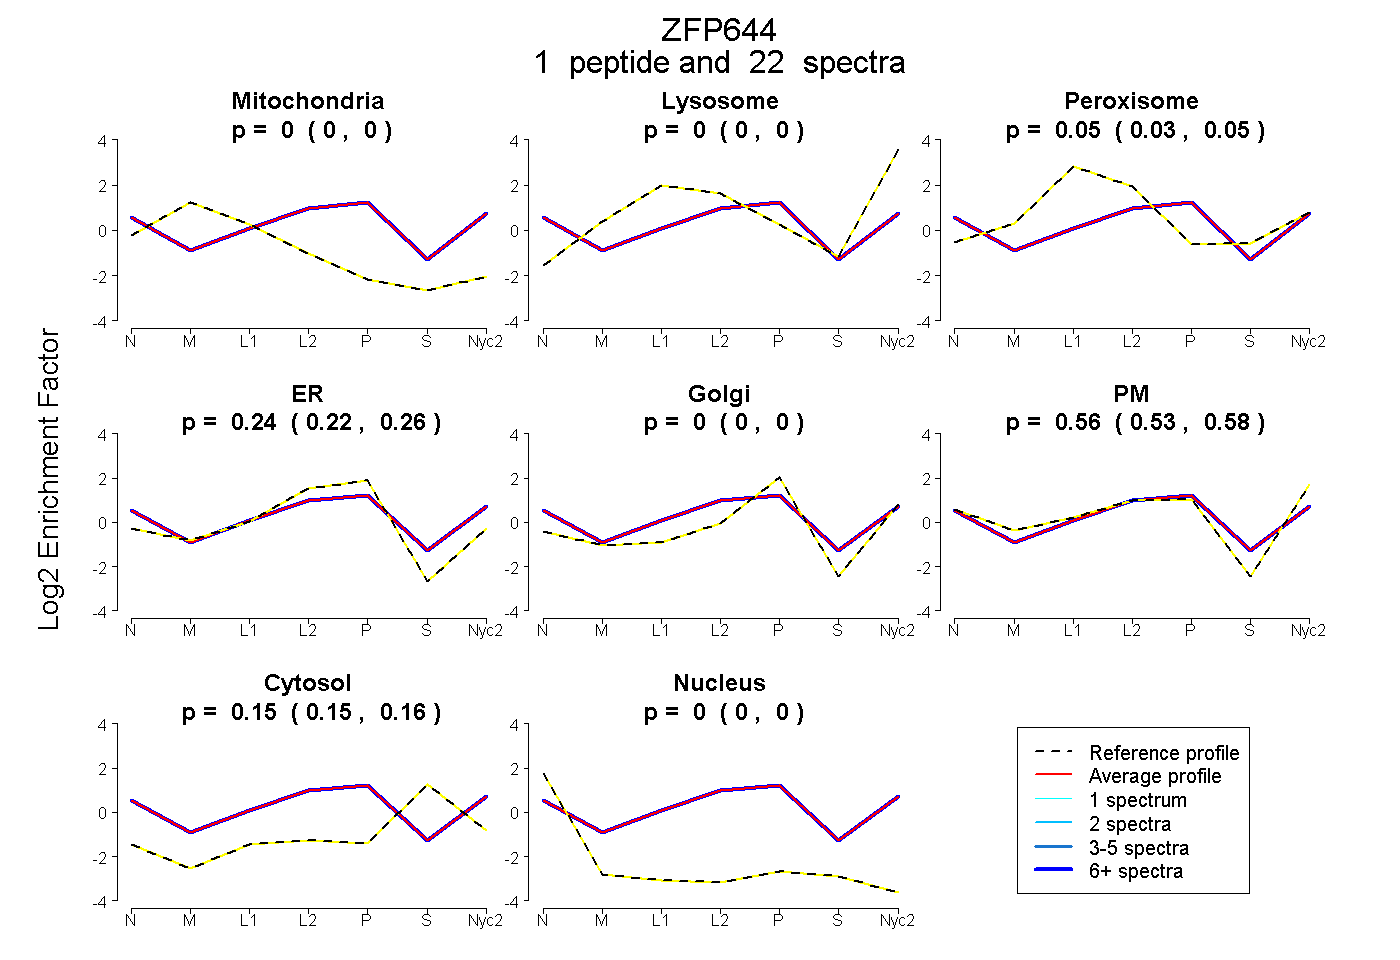
0.000 | 0.000
0.000 | 0.000
0.034 | 0.055
0.222 | 0.262
0.000 | 0.000
0.531 | 0.579
0.147 | 0.158
0.000 | 0.000
1peptide
spectrum
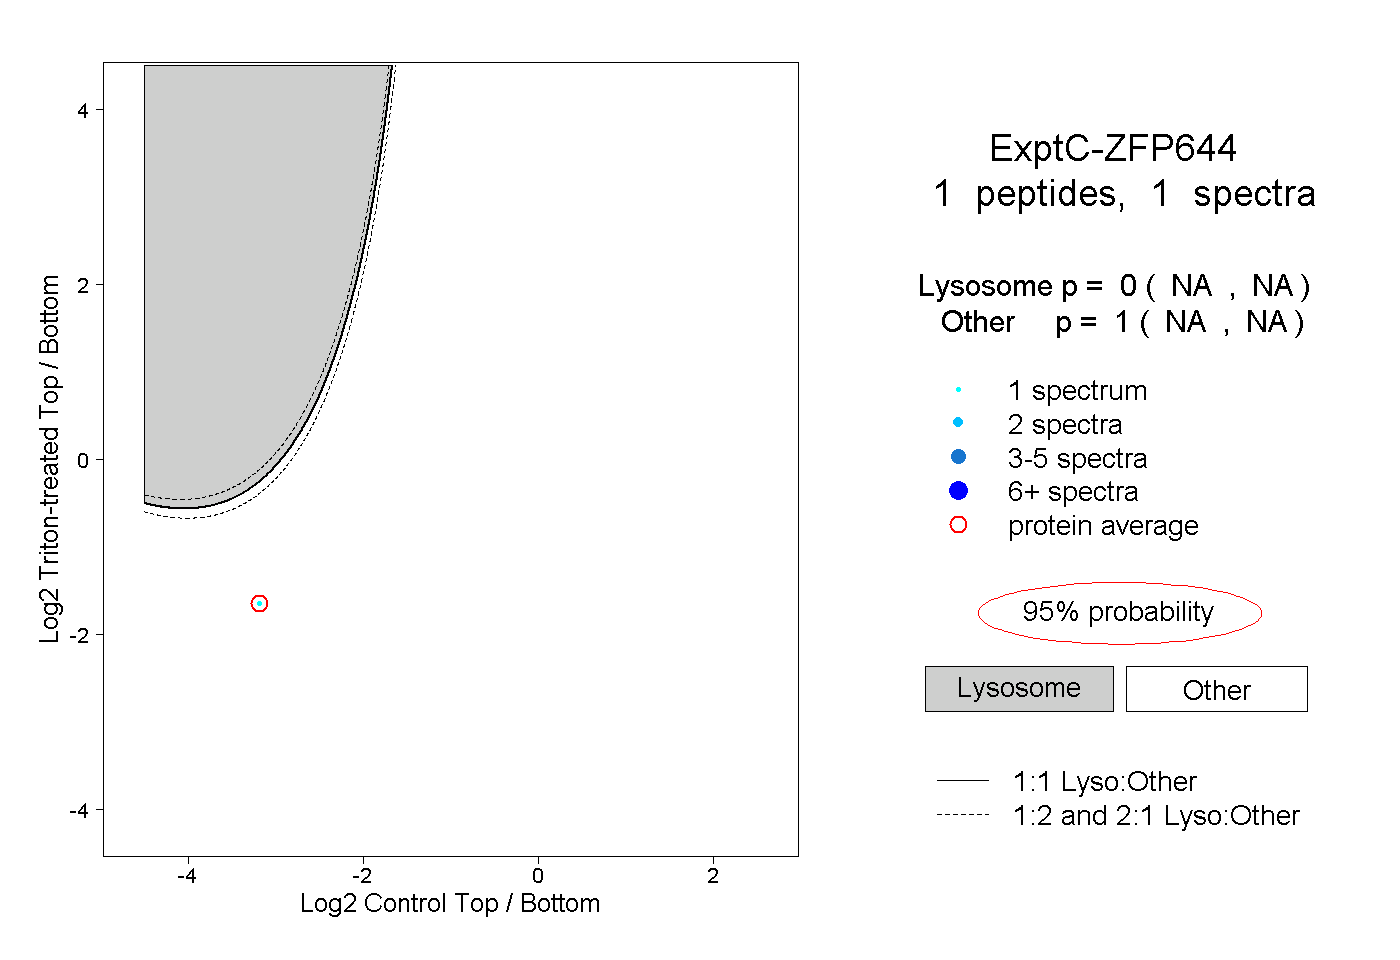
NA | NA
NA | NA
1peptide
spectra
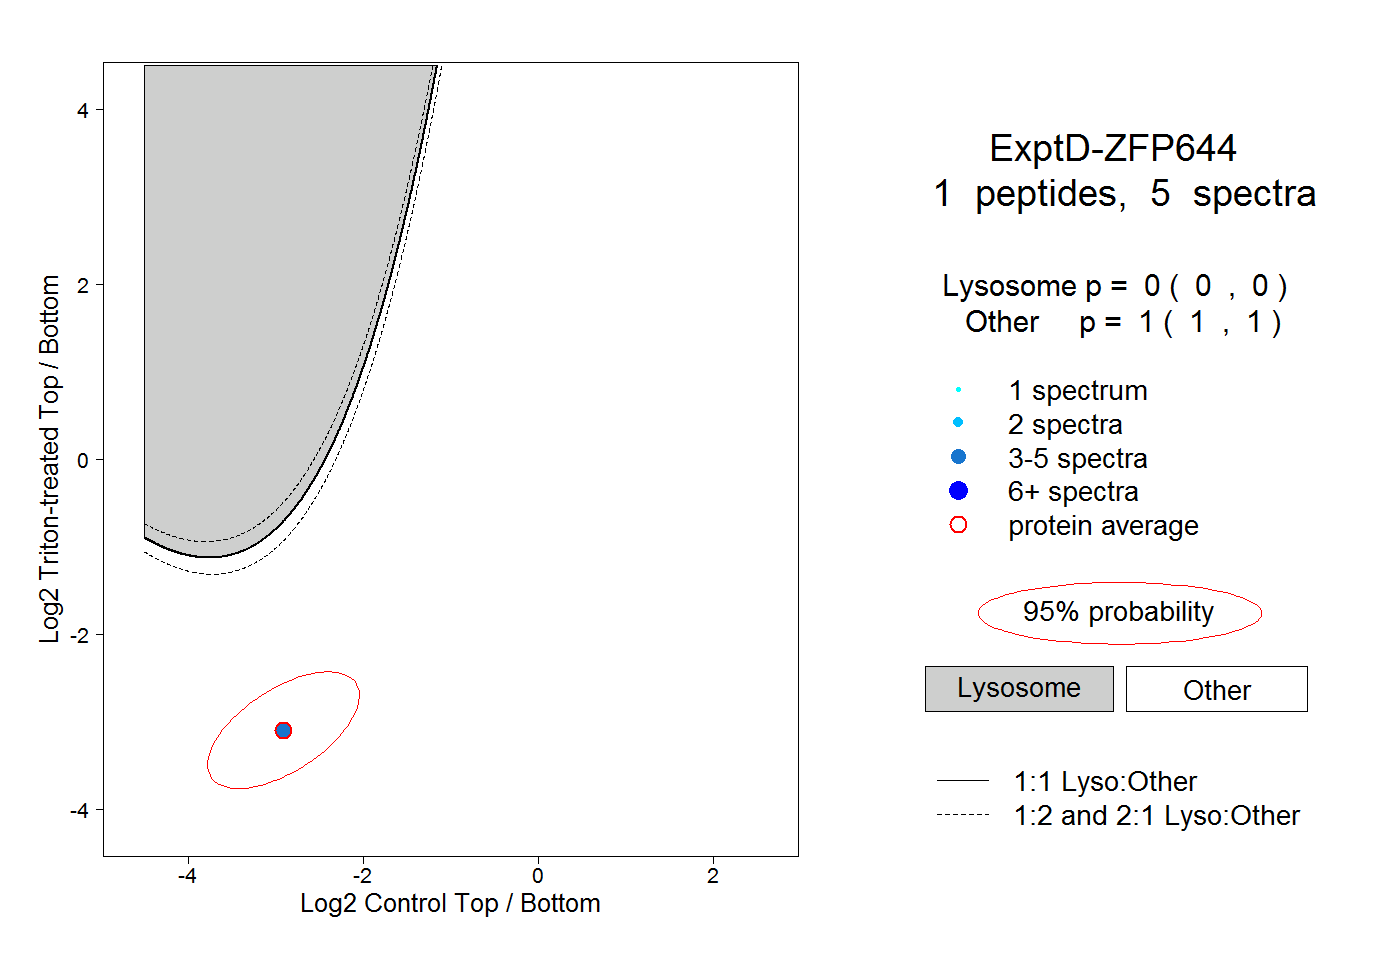
0.000 | 0.000
1.000 | 1.000