 3
3peptides
spectra
0.000 | 0.104
0.000 | 0.000
0.000 | 0.216
0.000 | 0.371
0.000 | 0.073
0.000 | 0.317
0.183 | 0.307
0.198 | 0.338
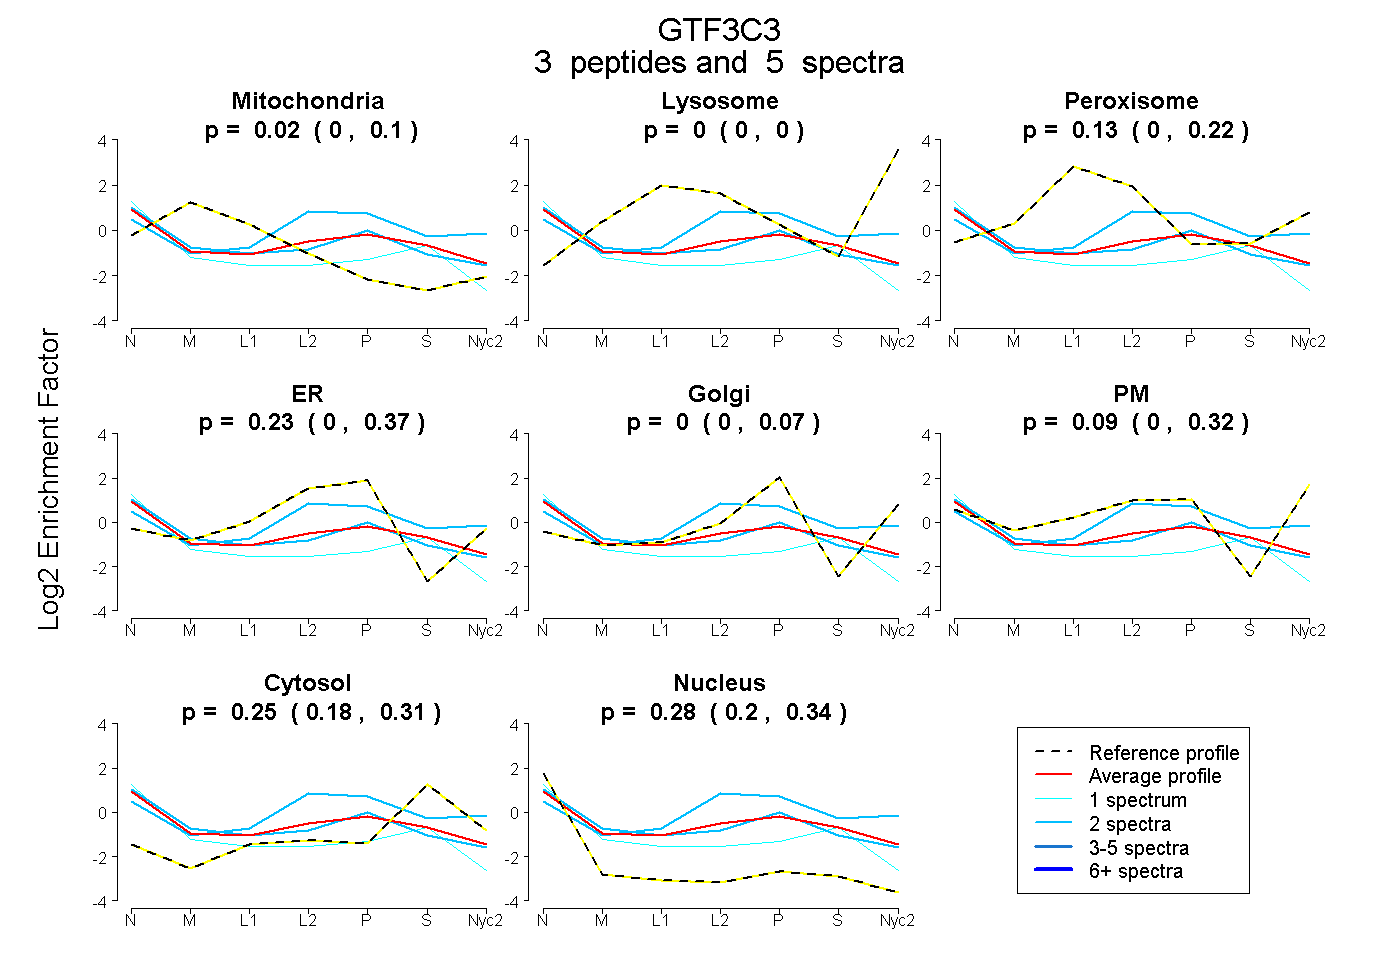
| Plot | Mito | Lyso | Perox | ER | Golgi | PM | Cytosol | Nucleus | |||||
| Expt A |
3 peptides |
5 spectra |
|
0.016 0.000 | 0.104 |
0.000 0.000 | 0.000 |
0.127 0.000 | 0.216 |
0.232 0.000 | 0.371 |
0.000 0.000 | 0.073 |
0.095 0.000 | 0.317 |
0.246 0.183 | 0.307 |
0.284 0.198 | 0.338 |
| 2 spectra, FMQLAR | 0.119 | 0.000 | 0.021 | 0.255 | 0.000 | 0.143 | 0.195 | 0.267 | ||
| 1 spectrum, ETLEEGTSEENK | 0.099 | 0.000 | 0.137 | 0.041 | 0.000 | 0.000 | 0.237 | 0.486 | ||
| 2 spectra, HALTVQGFSFLNR | 0.000 | 0.000 | 0.015 | 0.326 | 0.000 | 0.292 | 0.368 | 0.000 |