 2
2peptides
spectra
0.000 | 0.098
0.000 | 0.000
0.051 | 0.200
0.000 | 0.378
0.096 | 0.448
0.000 | 0.000
0.267 | 0.404
0.000 | 0.000
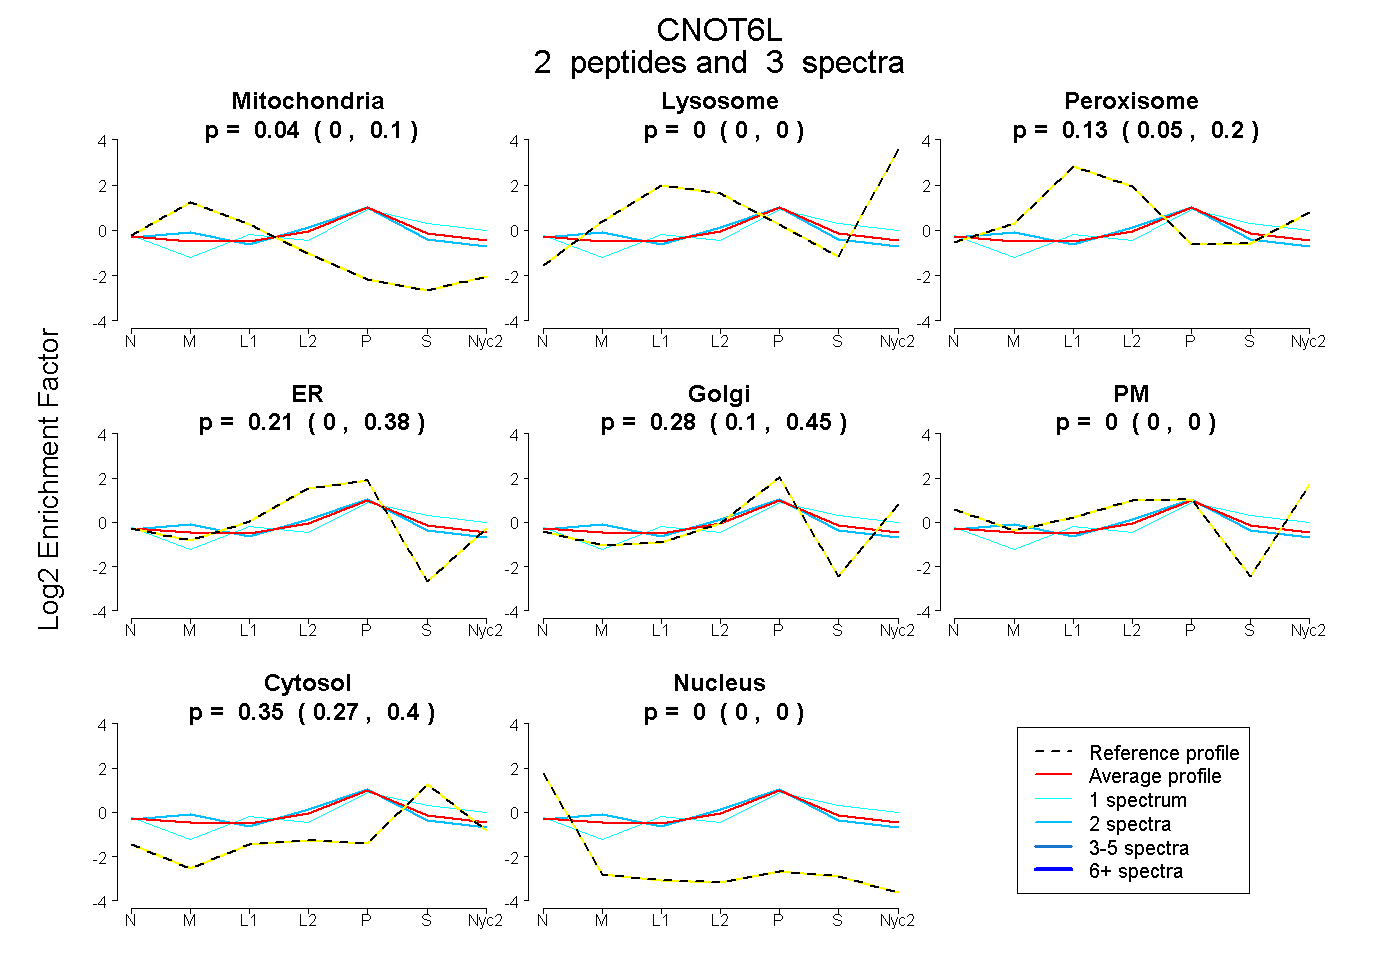
| Plot | Mito | Lyso | Perox | ER | Golgi | PM | Cytosol | Nucleus | |||||
| Expt A |
2 peptides |
3 spectra |
|
0.036 0.000 | 0.098 |
0.000 0.000 | 0.000 |
0.129 0.051 | 0.200 |
0.212 0.000 | 0.378 |
0.278 0.096 | 0.448 |
0.000 0.000 | 0.000 |
0.346 0.267 | 0.404 |
0.000 0.000 | 0.000 |
| 2 spectra, ITHGFQLK | 0.100 | 0.000 | 0.071 | 0.347 | 0.182 | 0.000 | 0.301 | 0.000 | ||
| 1 spectrum, ELLLNDNYLR | 0.000 | 0.000 | 0.189 | 0.000 | 0.400 | 0.000 | 0.411 | 0.000 |
| Plot | Lyso | Other | |||||||||||
| Expt C |
2 peptides |
2 spectra |
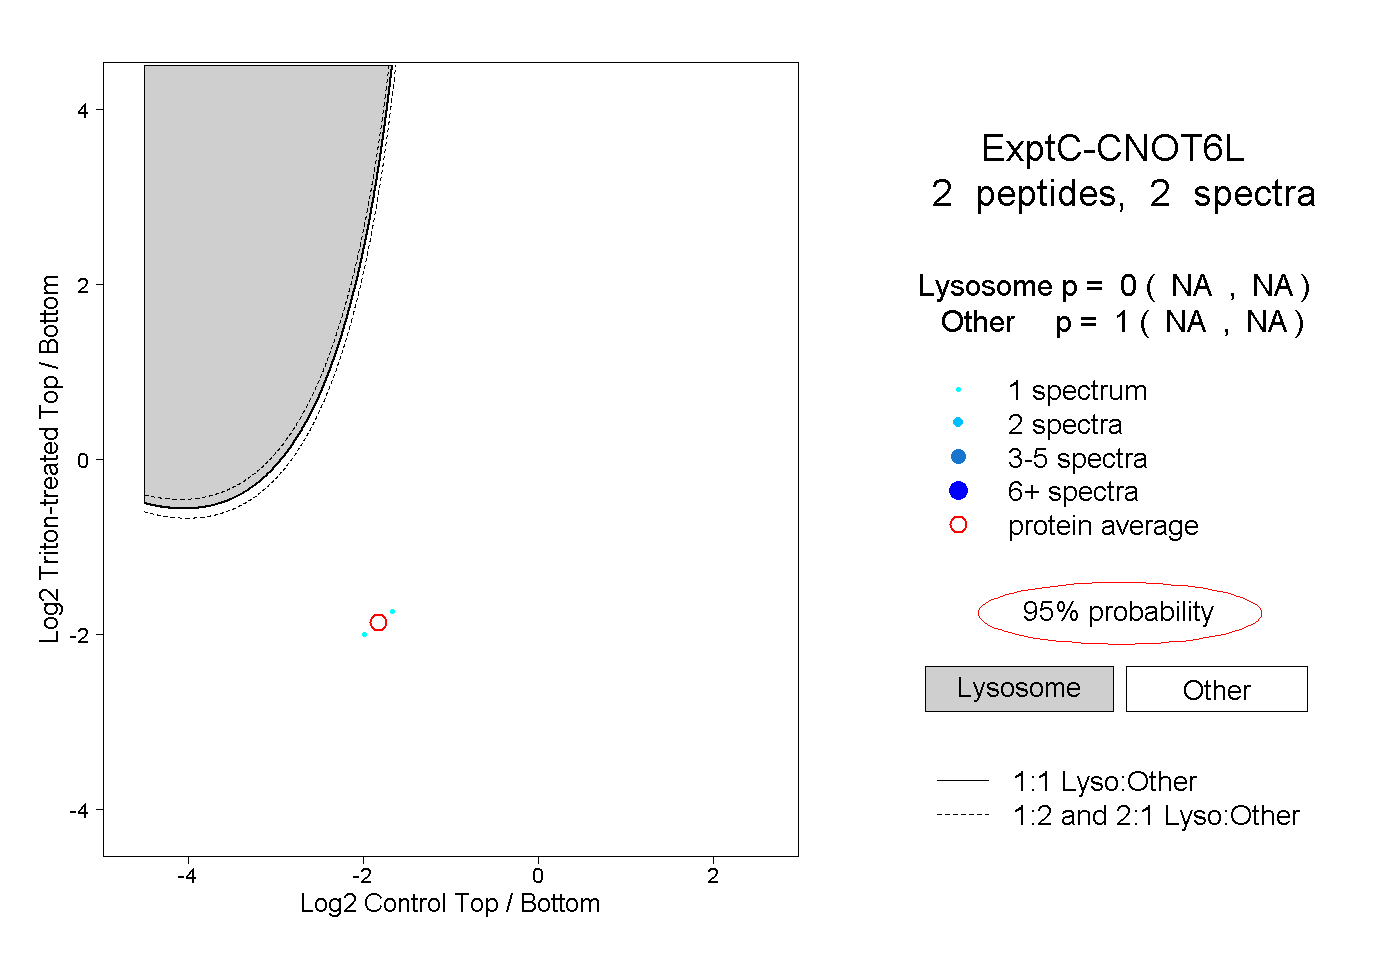 |
0.000 NA | NA |
1.000 NA | NA |