 5
5peptides
spectra
0.000 | 0.000
0.000 | 0.000
0.000 | 0.000
0.138 | 0.312
0.000 | 0.149
0.000 | 0.000
0.317 | 0.359
0.324 | 0.402
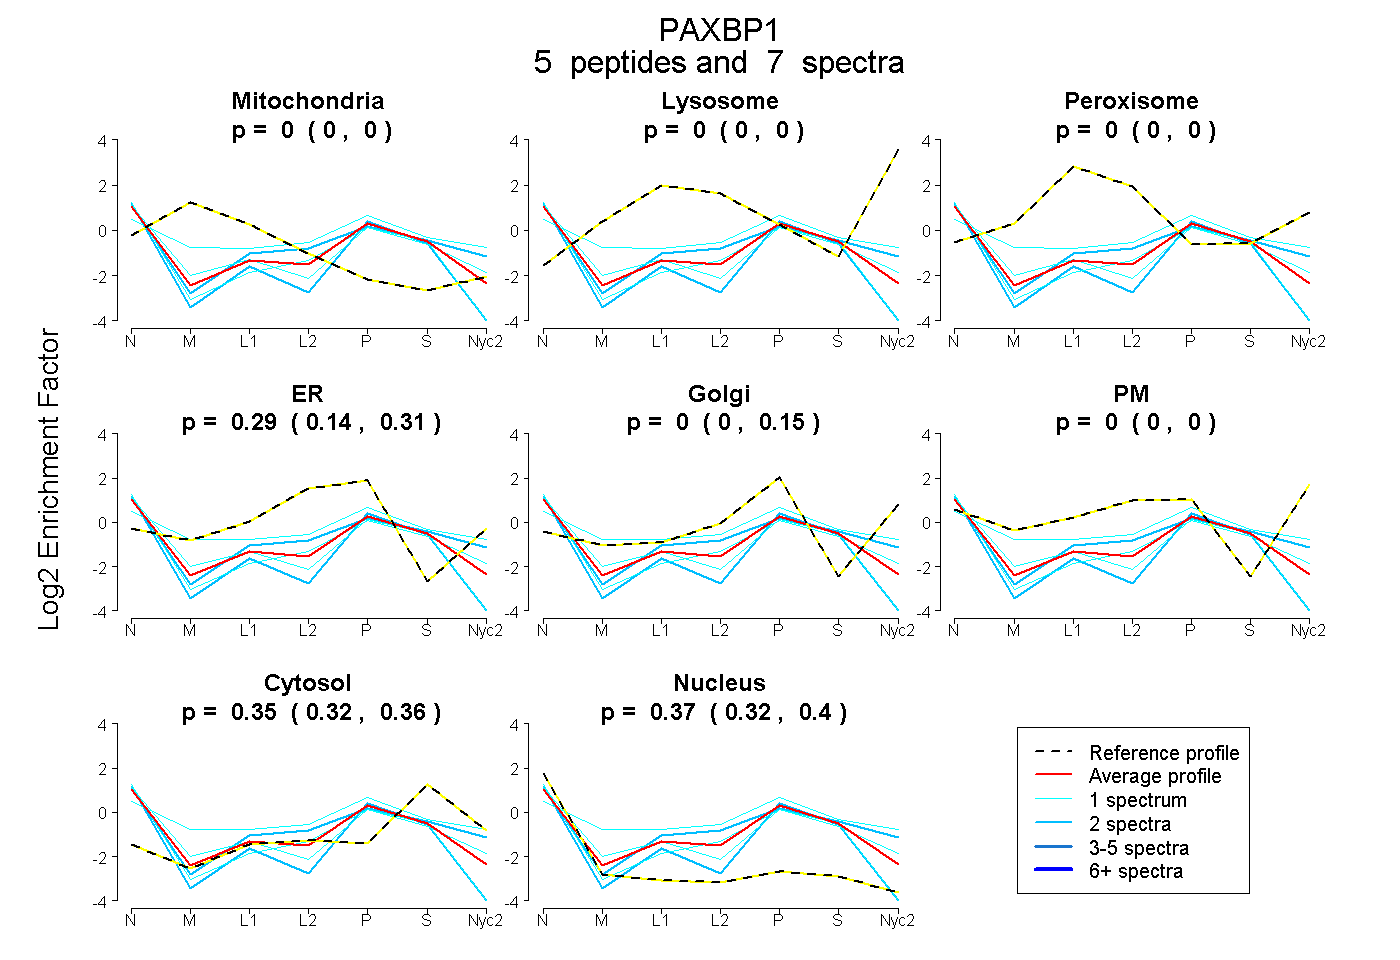
| Plot | Mito | Lyso | Perox | ER | Golgi | PM | Cytosol | Nucleus | |||||
| Expt A |
5 peptides |
7 spectra |
|
0.000 0.000 | 0.000 |
0.000 0.000 | 0.000 |
0.000 0.000 | 0.000 |
0.289 0.138 | 0.312 |
0.000 0.000 | 0.149 |
0.000 0.000 | 0.000 |
0.346 0.317 | 0.359 |
0.365 0.324 | 0.402 |
| 1 spectrum, SDNTVPFK | 0.052 | 0.000 | 0.032 | 0.185 | 0.162 | 0.136 | 0.350 | 0.082 | ||
| 2 spectra, ALMAPNLDSFGR | 0.000 | 0.000 | 0.000 | 0.115 | 0.000 | 0.000 | 0.303 | 0.583 | ||
| 1 spectrum, VPLINELESAIHQLYK | 0.000 | 0.000 | 0.000 | 0.210 | 0.000 | 0.000 | 0.271 | 0.519 | ||
| 1 spectrum, TLQELSIDGLLNR | 0.000 | 0.000 | 0.000 | 0.135 | 0.155 | 0.000 | 0.326 | 0.384 | ||
| 2 spectra, LEGSSGGIGER | 0.000 | 0.000 | 0.000 | 0.224 | 0.000 | 0.137 | 0.391 | 0.248 |