 1
1peptide
spectra
0.000 | 0.000
0.536 | 0.592
0.000 | 0.000
0.000 | 0.000
0.070 | 0.156
0.254 | 0.370
0.000 | 0.000
0.000 | 0.000
1peptide
spectra
0.505 | 1.000
0.000 | 0.477
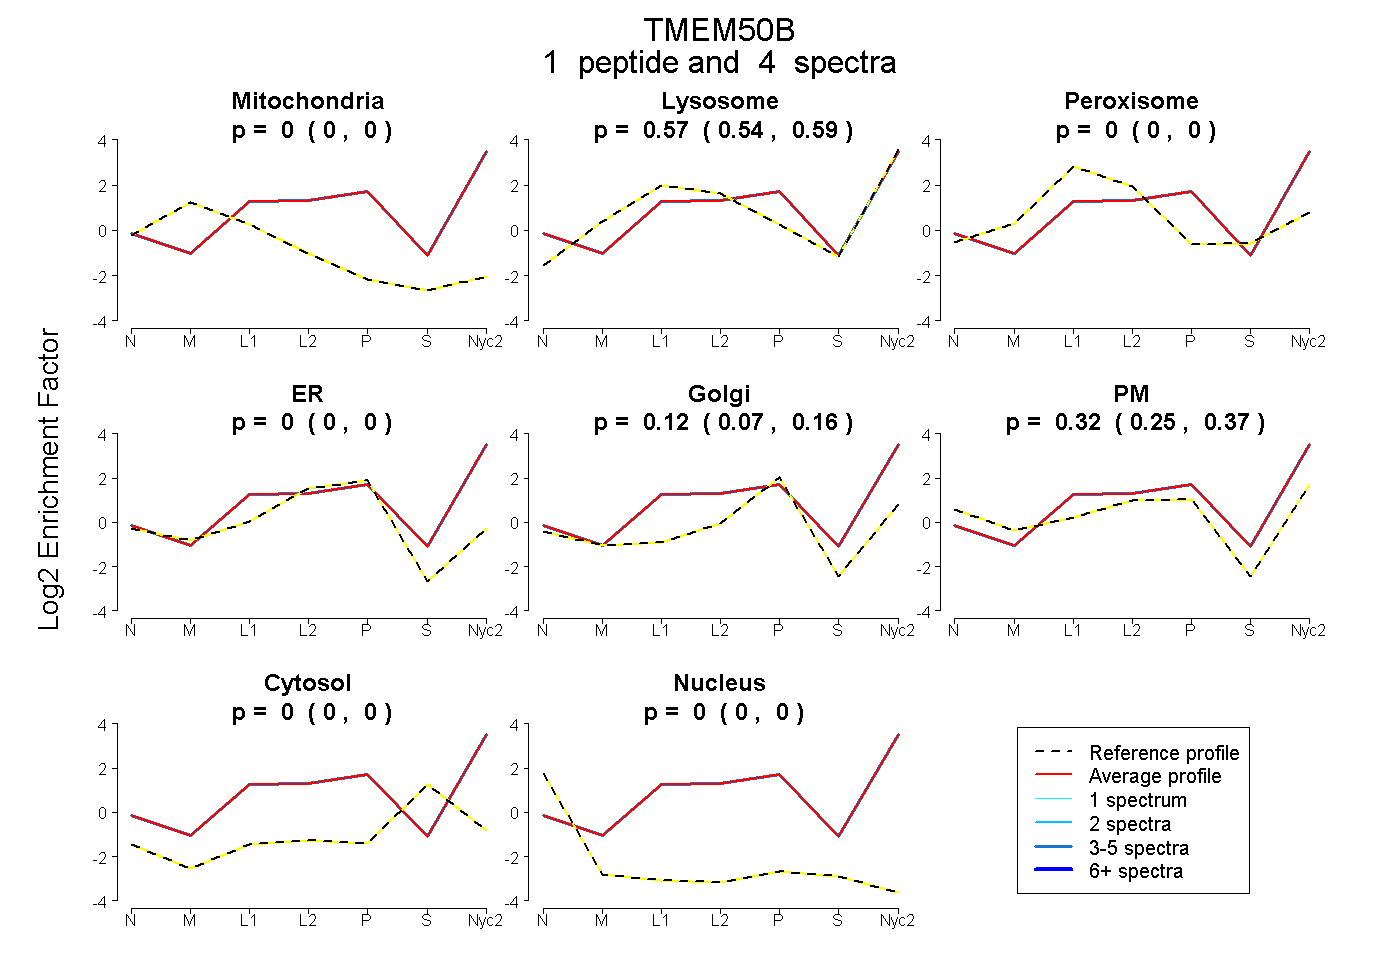
| Plot | Mito | Lyso | Perox | ER | Golgi | PM | Cytosol | Nucleus | |||||
| Expt A |
1 peptide |
4 spectra |
|
0.000 0.000 | 0.000 |
0.567 0.536 | 0.592 |
0.000 0.000 | 0.000 |
0.000 0.000 | 0.000 |
0.118 0.070 | 0.156 |
0.315 0.254 | 0.370 |
0.000 0.000 | 0.000 |
0.000 0.000 | 0.000 |
||
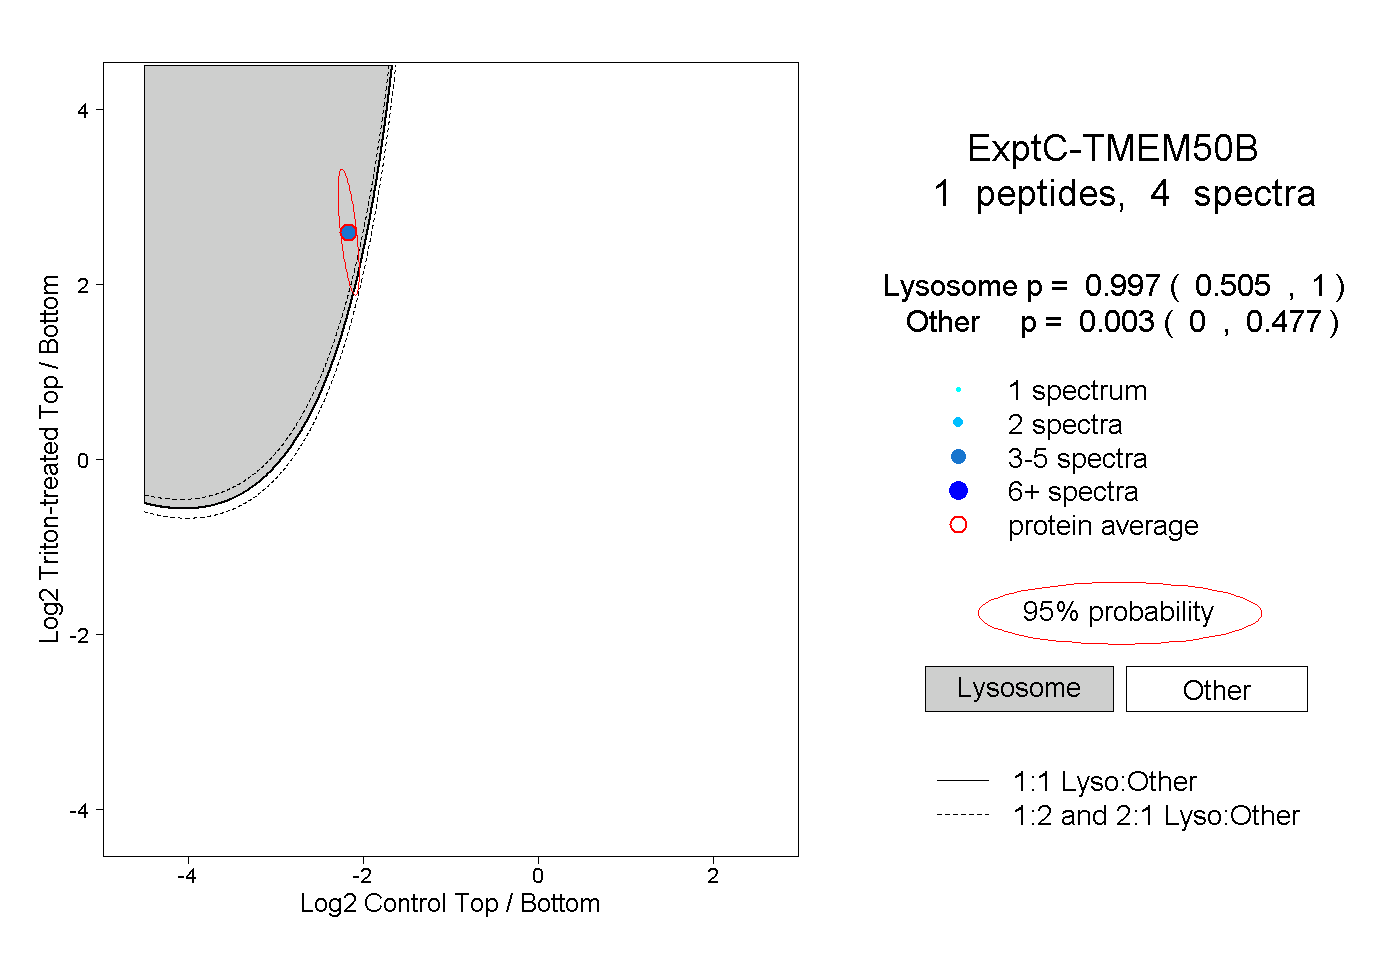
| Plot | Lyso | Other | |||||||||||
| Expt C |
1 peptide |
4 spectra |
|
0.997 0.505 | 1.000 |
0.003 0.000 | 0.477 |