 3
3peptides
spectra
0.664 | 0.747
0.066 | 0.146
0.000 | 0.000
0.000 | 0.000
0.000 | 0.000
0.117 | 0.233
0.000 | 0.000
0.000 | 0.000
| Plot | Mito | Lyso | Perox | ER | Golgi | PM | Cytosol | Nucleus | |||||
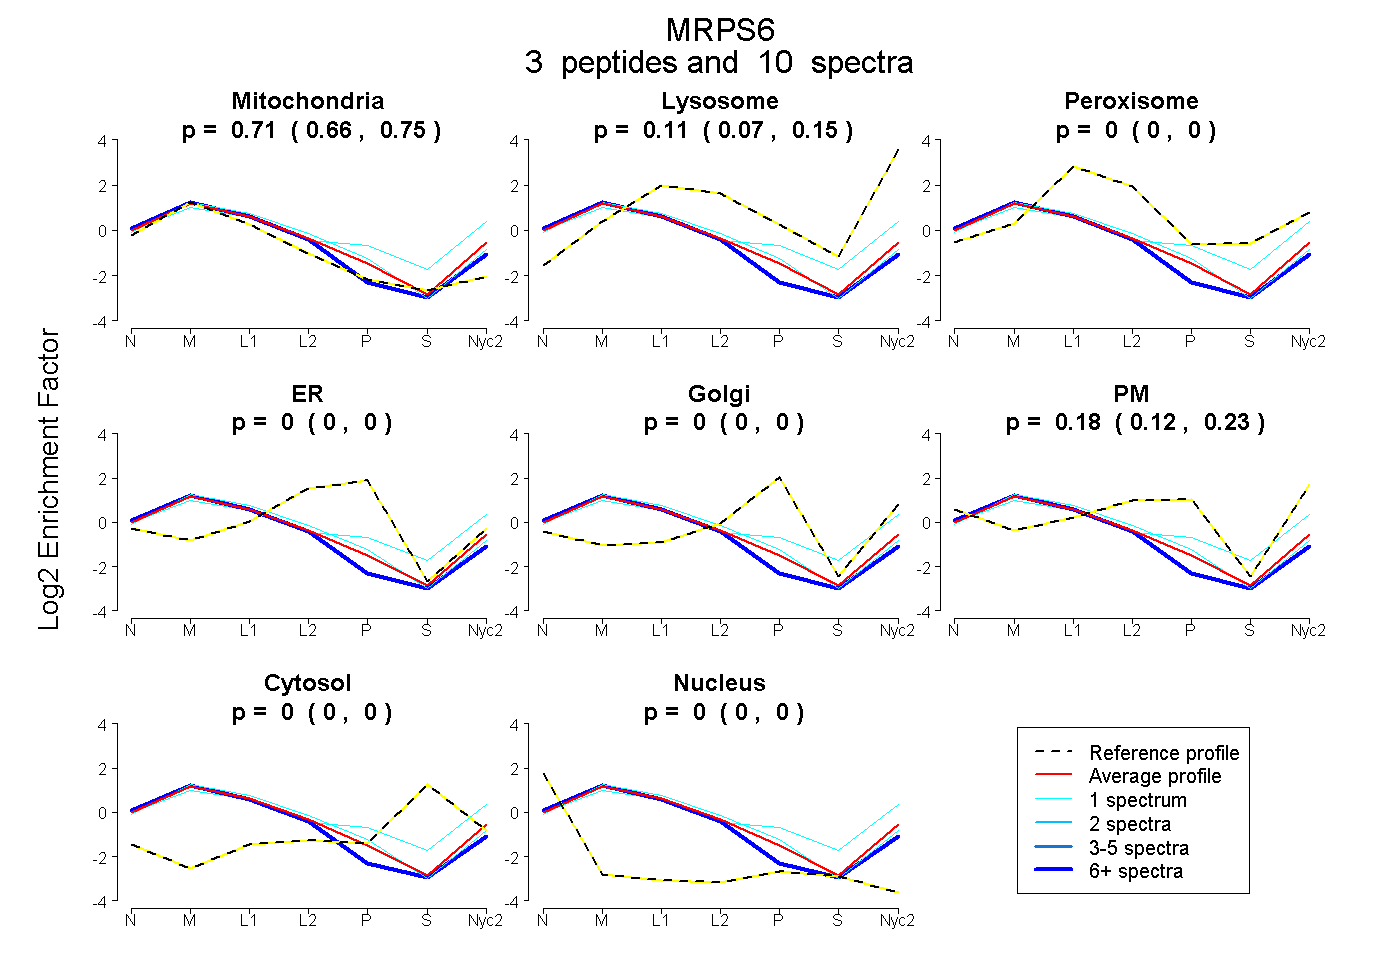
| Expt A |
3 peptides |
10 spectra |
|
0.710 0.664 | 0.747 |
0.111 0.066 | 0.146 |
0.000 0.000 | 0.000 |
0.000 0.000 | 0.000 |
0.000 0.000 | 0.000 |
0.179 0.117 | 0.233 |
0.000 0.000 | 0.000 |
0.000 0.000 | 0.000 |
| 1 spectrum, TIESLMDR | 0.703 | 0.078 | 0.027 | 0.017 | 0.000 | 0.176 | 0.000 | 0.000 | ||
| 1 spectrum, DTDVVRPNIVK | 0.503 | 0.225 | 0.000 | 0.000 | 0.000 | 0.240 | 0.032 | 0.000 | ||
| 8 spectra, NLENLGER | 0.857 | 0.079 | 0.013 | 0.000 | 0.000 | 0.051 | 0.000 | 0.000 |
| Plot | Lyso | Other | |||||||||||
| Expt C |
5 peptides |
34 spectra |
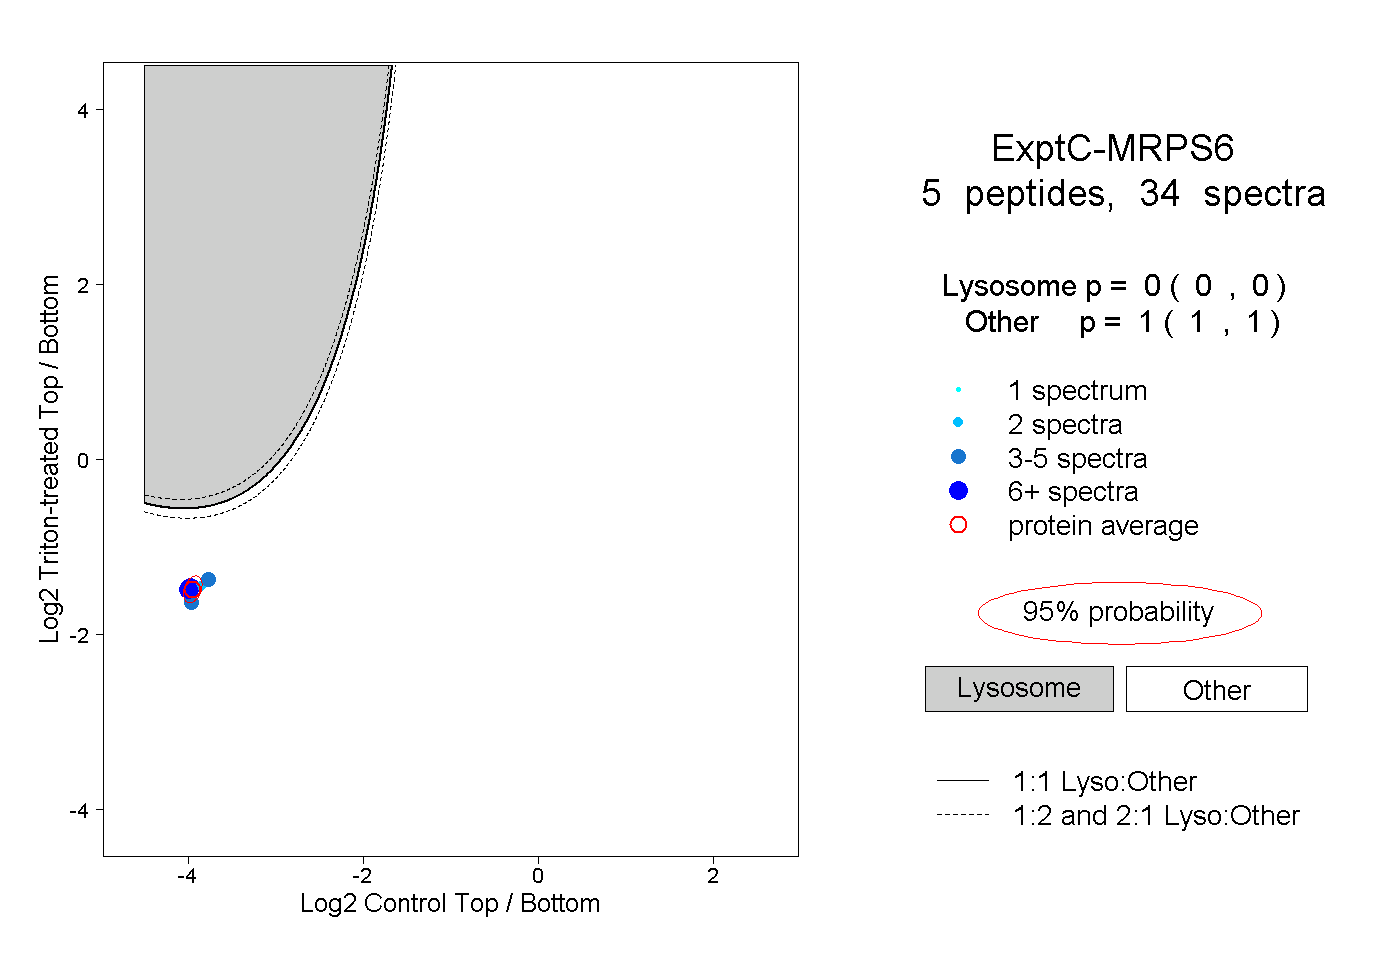 |
0.000 0.000 | 0.000 |
1.000 1.000 | 1.000 |
||||||||
| Plot | Lyso | Other | |||||||||||
| Expt D |
2 peptides |
5 spectra |
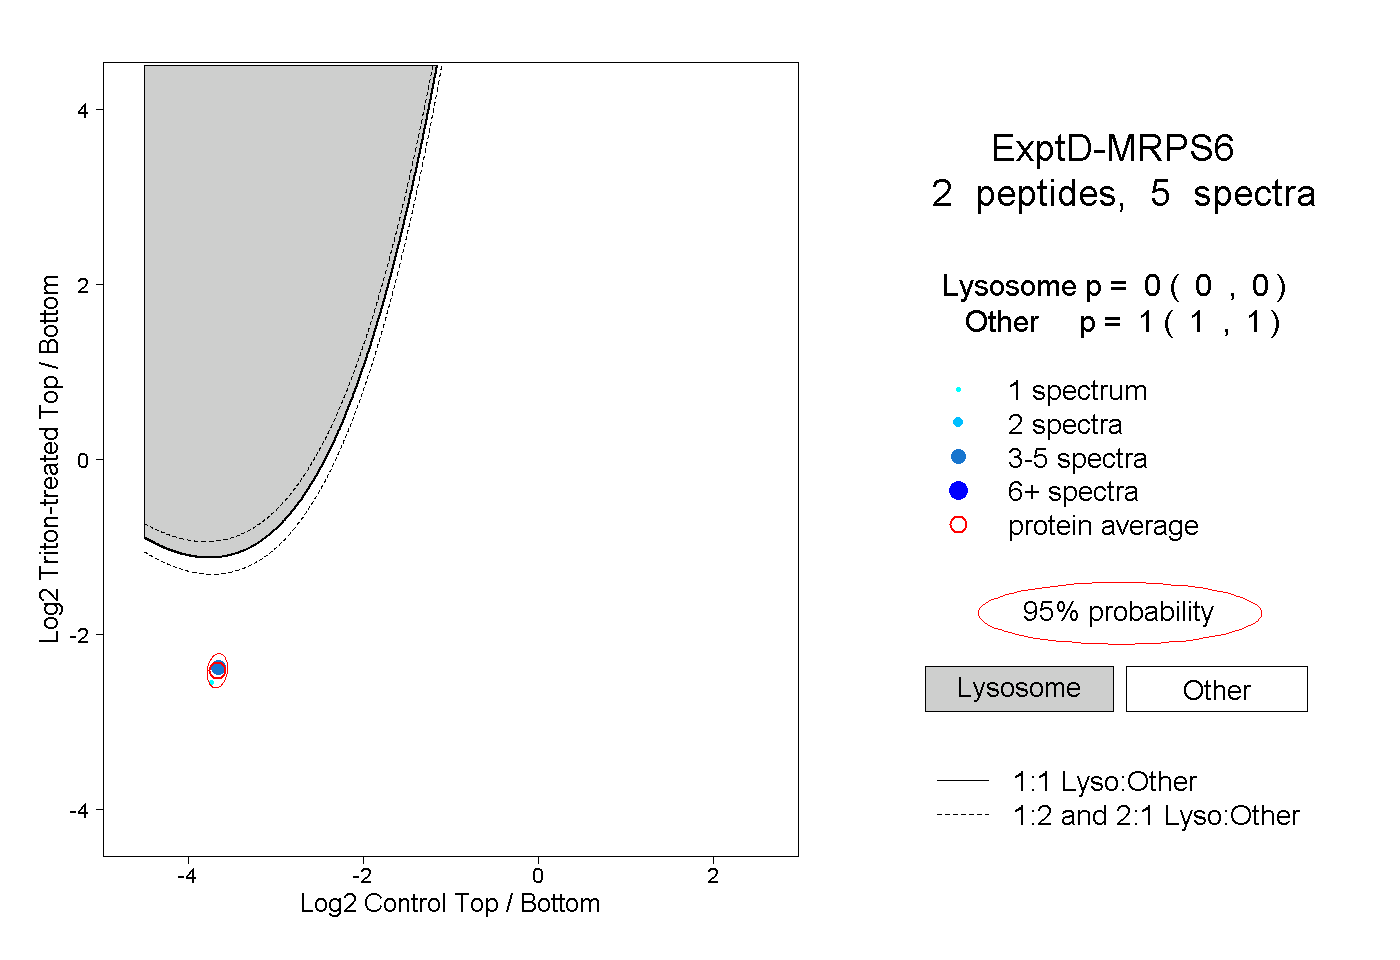 |
0.000 0.000 | 0.000 |
1.000 1.000 | 1.000 |