 12
12peptides
spectra
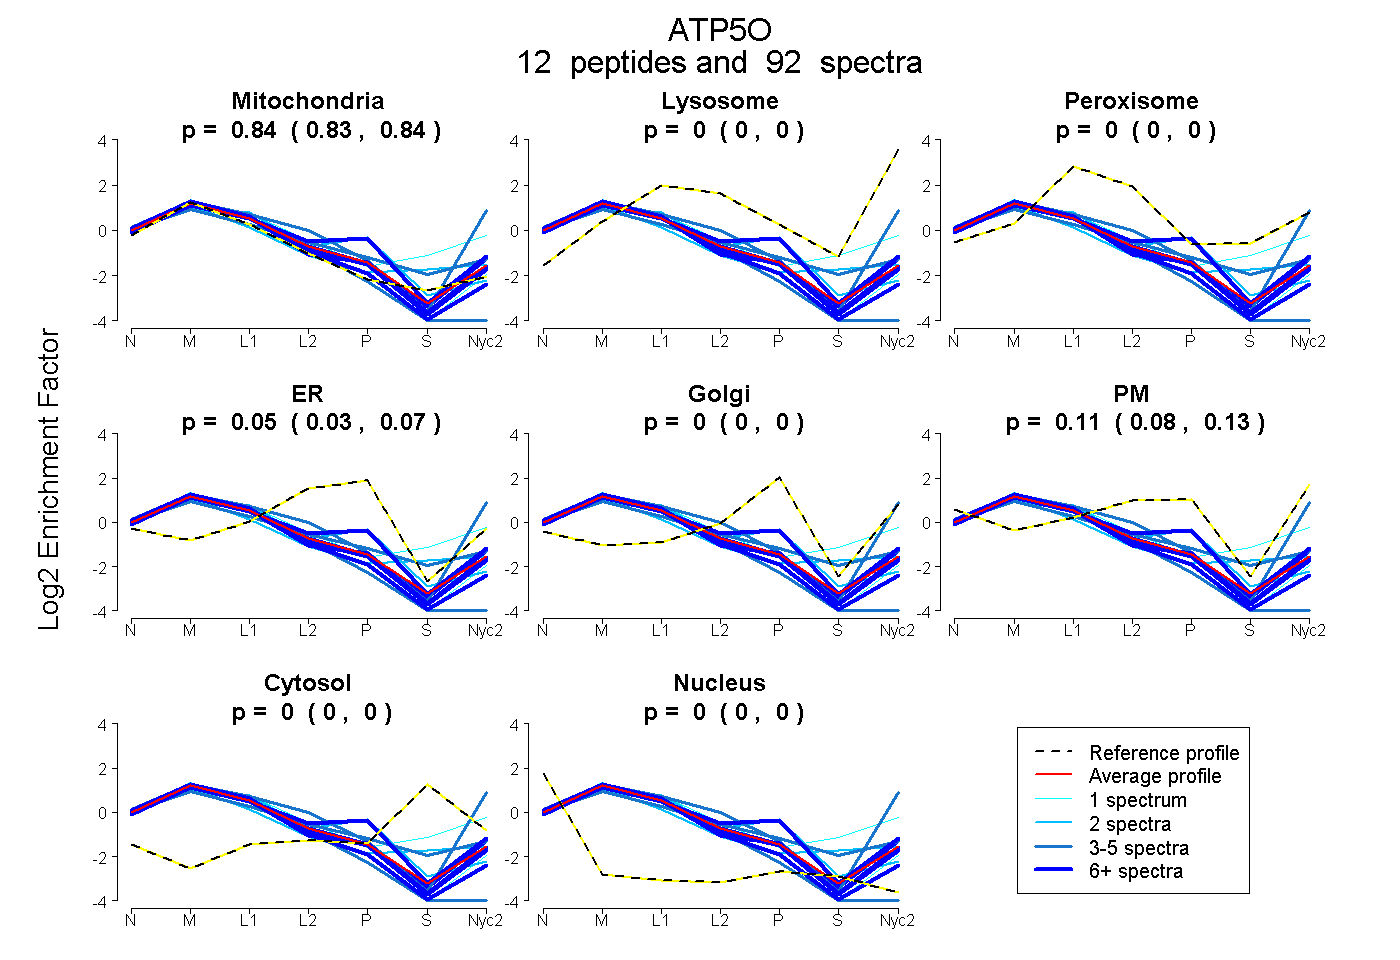
0.831 | 0.844
0.000 | 0.000
0.000 | 0.000
0.033 | 0.073
0.000 | 0.000
0.079 | 0.130
0.000 | 0.000
0.000 | 0.000
| Plot | Mito | Lyso | Perox | ER | Golgi | PM | Cytosol | Nucleus | |||||
| Expt A |
12 peptides |
92 spectra |
|
0.838 0.831 | 0.844 |
0.000 0.000 | 0.000 |
0.000 0.000 | 0.000 |
0.055 0.033 | 0.073 |
0.000 0.000 | 0.000 |
0.107 0.079 | 0.130 |
0.000 0.000 | 0.000 |
0.000 0.000 | 0.000 |
| 6 spectra, YATALYSAASK | 0.647 | 0.000 | 0.000 | 0.230 | 0.008 | 0.115 | 0.000 | 0.000 | ||
| 5 spectra, VGQLLK | 0.531 | 0.228 | 0.000 | 0.000 | 0.000 | 0.241 | 0.000 | 0.000 | ||
| 26 spectra, LVRPPVQVYGIEGR | 0.878 | 0.000 | 0.000 | 0.068 | 0.000 | 0.054 | 0.000 | 0.000 | ||
| 21 spectra, TDPSIMGGMIVR | 0.820 | 0.000 | 0.000 | 0.000 | 0.000 | 0.180 | 0.000 | 0.000 | ||
| 1 spectrum, GEVPCTVTTAFPLDEAVLSELK | 0.555 | 0.135 | 0.197 | 0.000 | 0.000 | 0.004 | 0.110 | 0.000 | ||
| 7 spectra, YVDMSAK | 0.871 | 0.000 | 0.000 | 0.027 | 0.000 | 0.102 | 0.000 | 0.000 | ||
| 2 spectra, LDQVEK | 0.815 | 0.022 | 0.032 | 0.000 | 0.000 | 0.010 | 0.120 | 0.000 | ||
| 2 spectra, LGNTQGVISAFSTIMSVHR | 0.724 | 0.000 | 0.000 | 0.276 | 0.000 | 0.000 | 0.000 | 0.000 | ||
| 5 spectra, TVLNSFLSK | 0.696 | 0.000 | 0.072 | 0.017 | 0.033 | 0.127 | 0.054 | 0.000 | ||
| 12 spectra, VSLAVLNPYIK | 0.985 | 0.000 | 0.000 | 0.012 | 0.000 | 0.000 | 0.000 | 0.002 | ||
| 4 spectra, GQILNLEVK | 0.924 | 0.000 | 0.000 | 0.000 | 0.000 | 0.000 | 0.000 | 0.076 | ||
| 1 spectrum, FSPLTANLMNLLAENGR | 0.988 | 0.000 | 0.000 | 0.000 | 0.000 | 0.012 | 0.000 | 0.000 |
| Plot | Mito | Lyso or Perox | ER | Golgi | PM | Cytosol | Nucleus | ||||||
| Expt B |
10 peptides |
68 spectra |
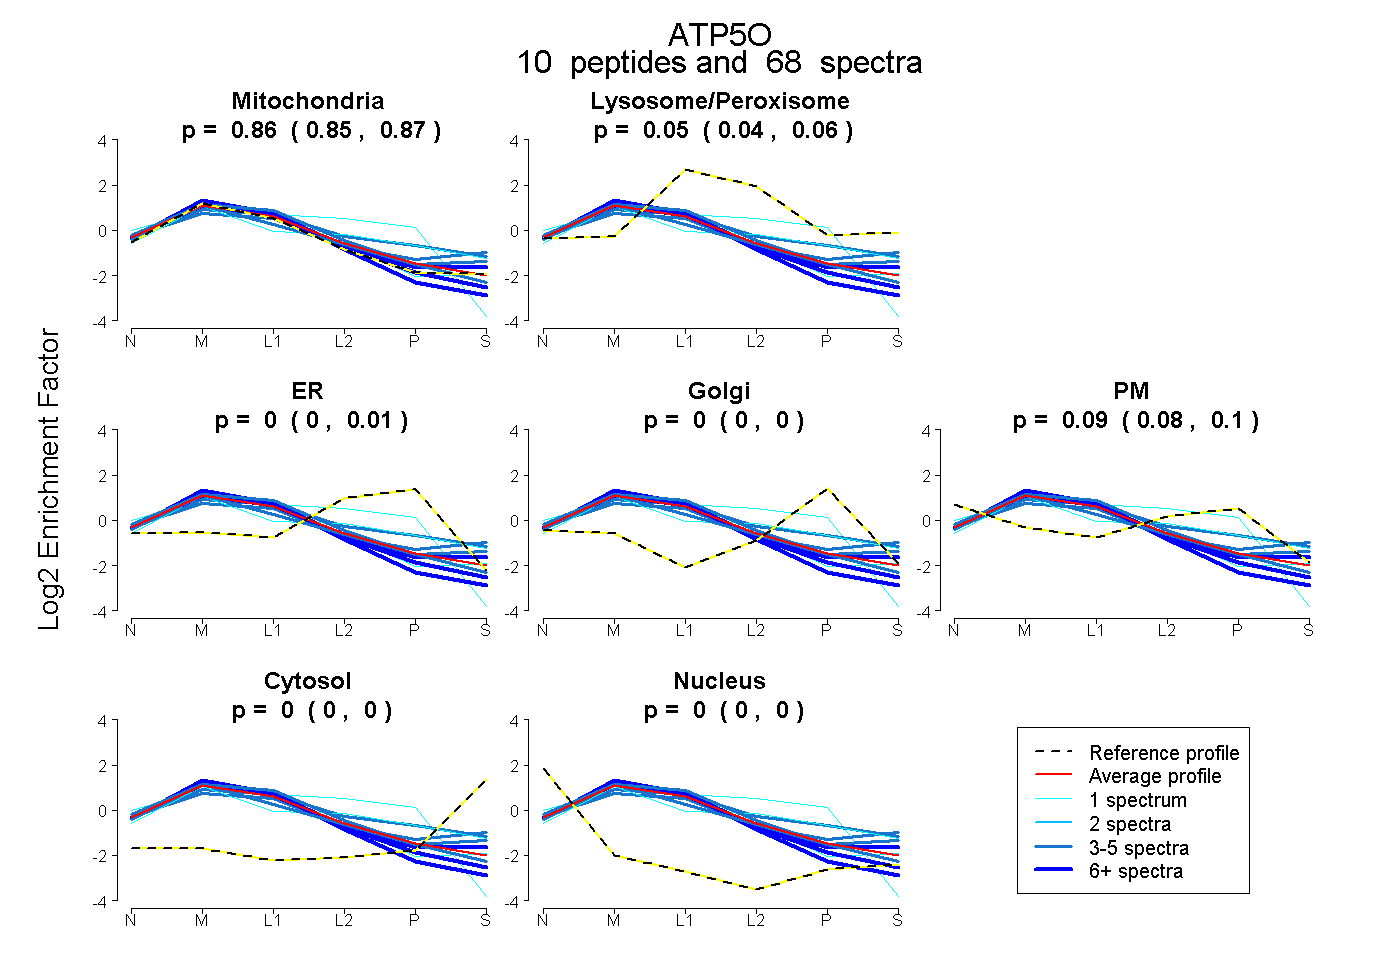 |
0.856 0.846 | 0.866 |
0.050 0.040 | 0.057 |
0.000 0.000 | 0.015 |
0.000 0.000 | 0.000 |
0.094 0.081 | 0.097 |
0.000 0.000 | 0.000 |
0.000 0.000 | 0.000 |
|||
| Plot | Lyso | Other | |||||||||||
| Expt C |
12 peptides |
398 spectra |
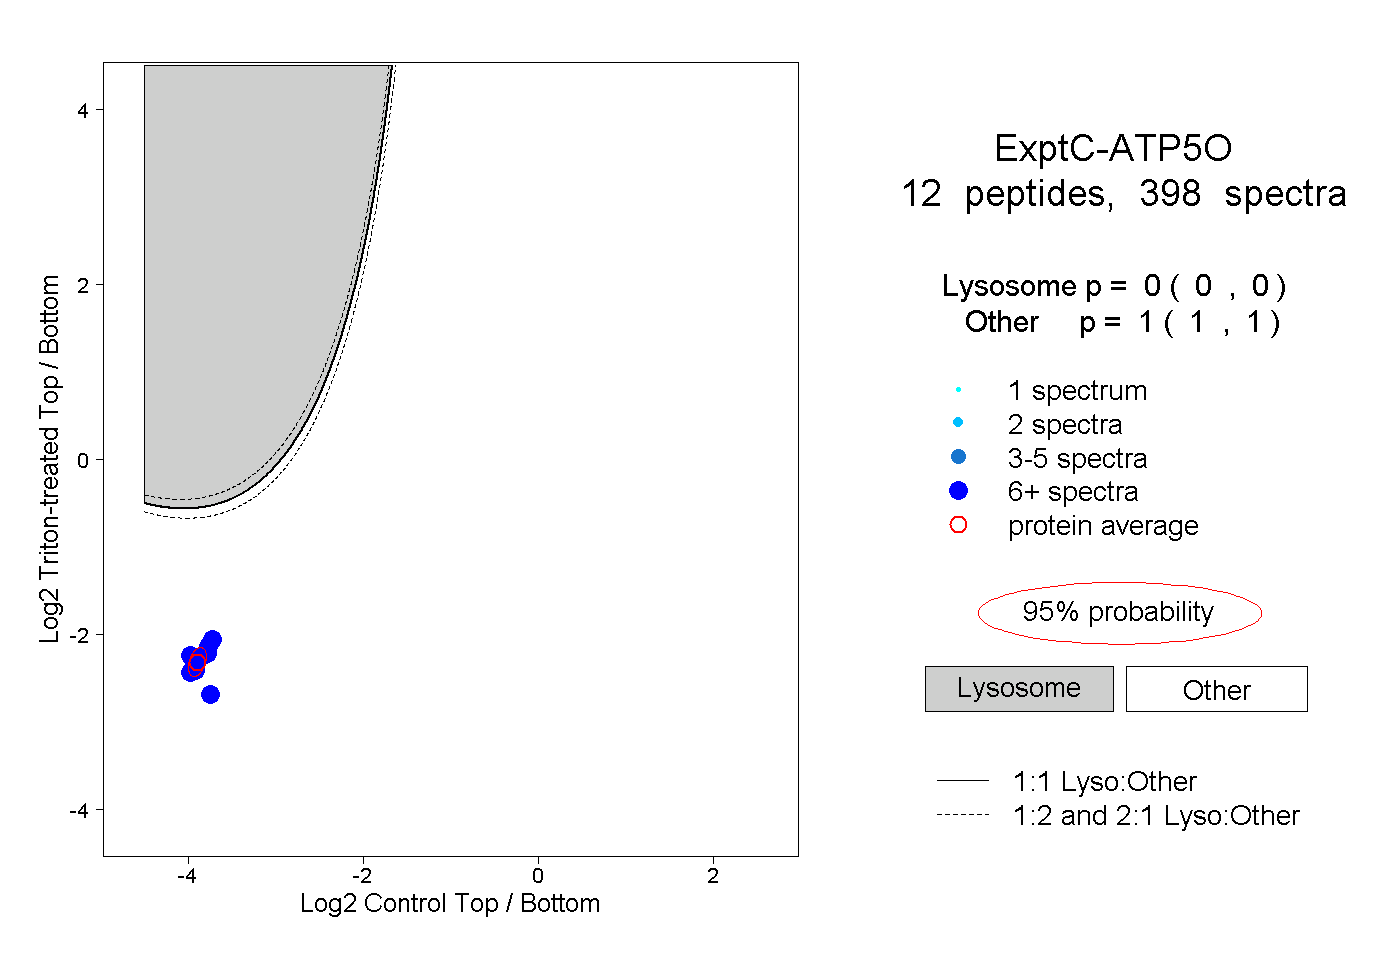 |
0.000 0.000 | 0.000 |
1.000 1.000 | 1.000 |
||||||||
| Plot | Lyso | Other | |||||||||||
| Expt D |
5 peptides |
8 spectra |
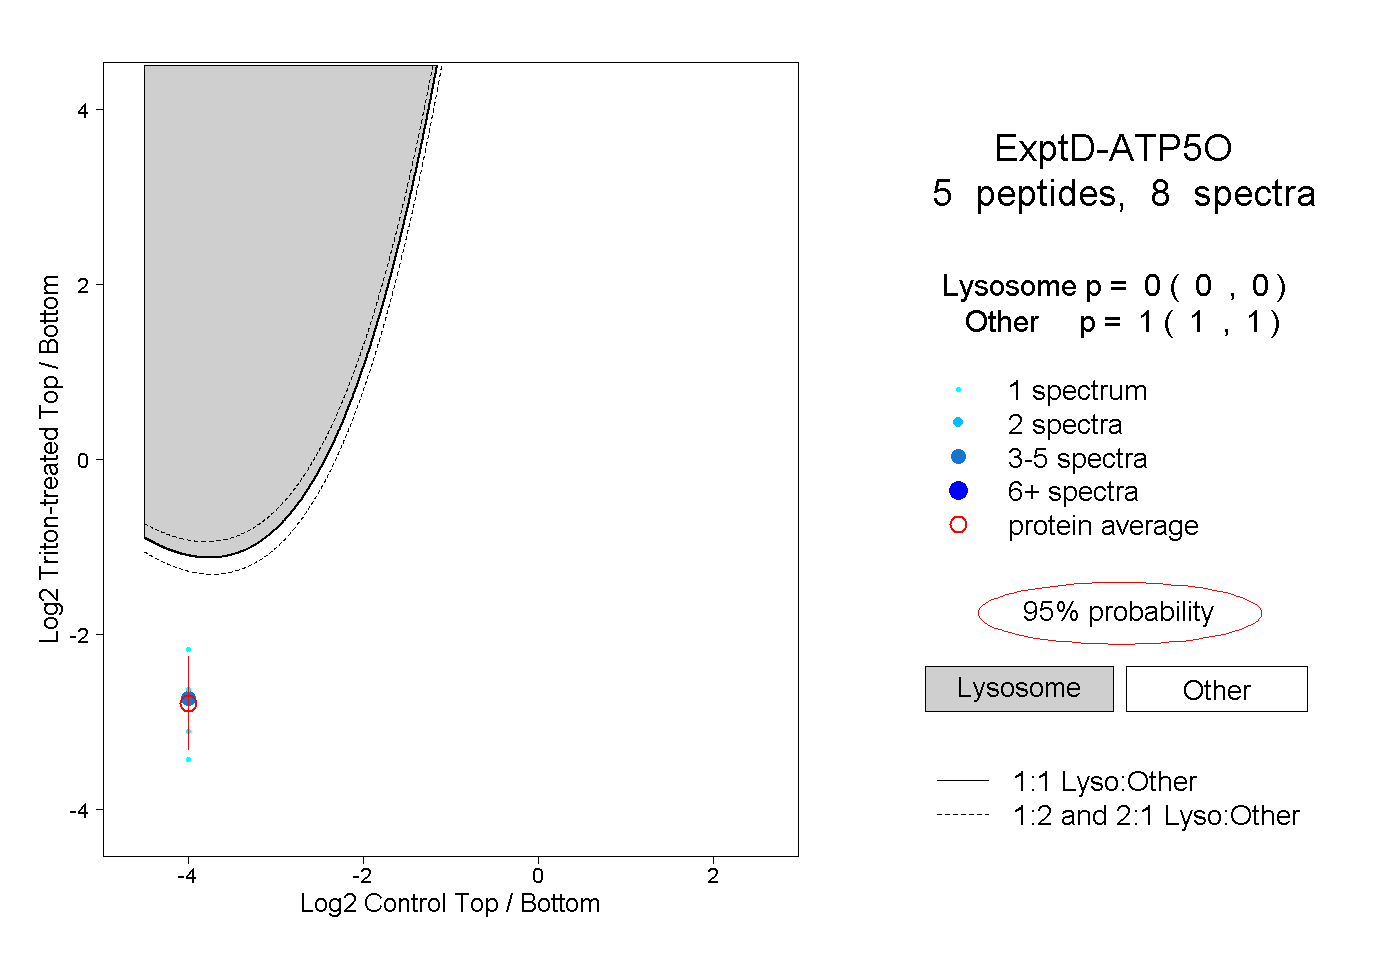 |
0.000 0.000 | 0.000 |
1.000 1.000 | 1.000 |