 12
12peptides
spectra
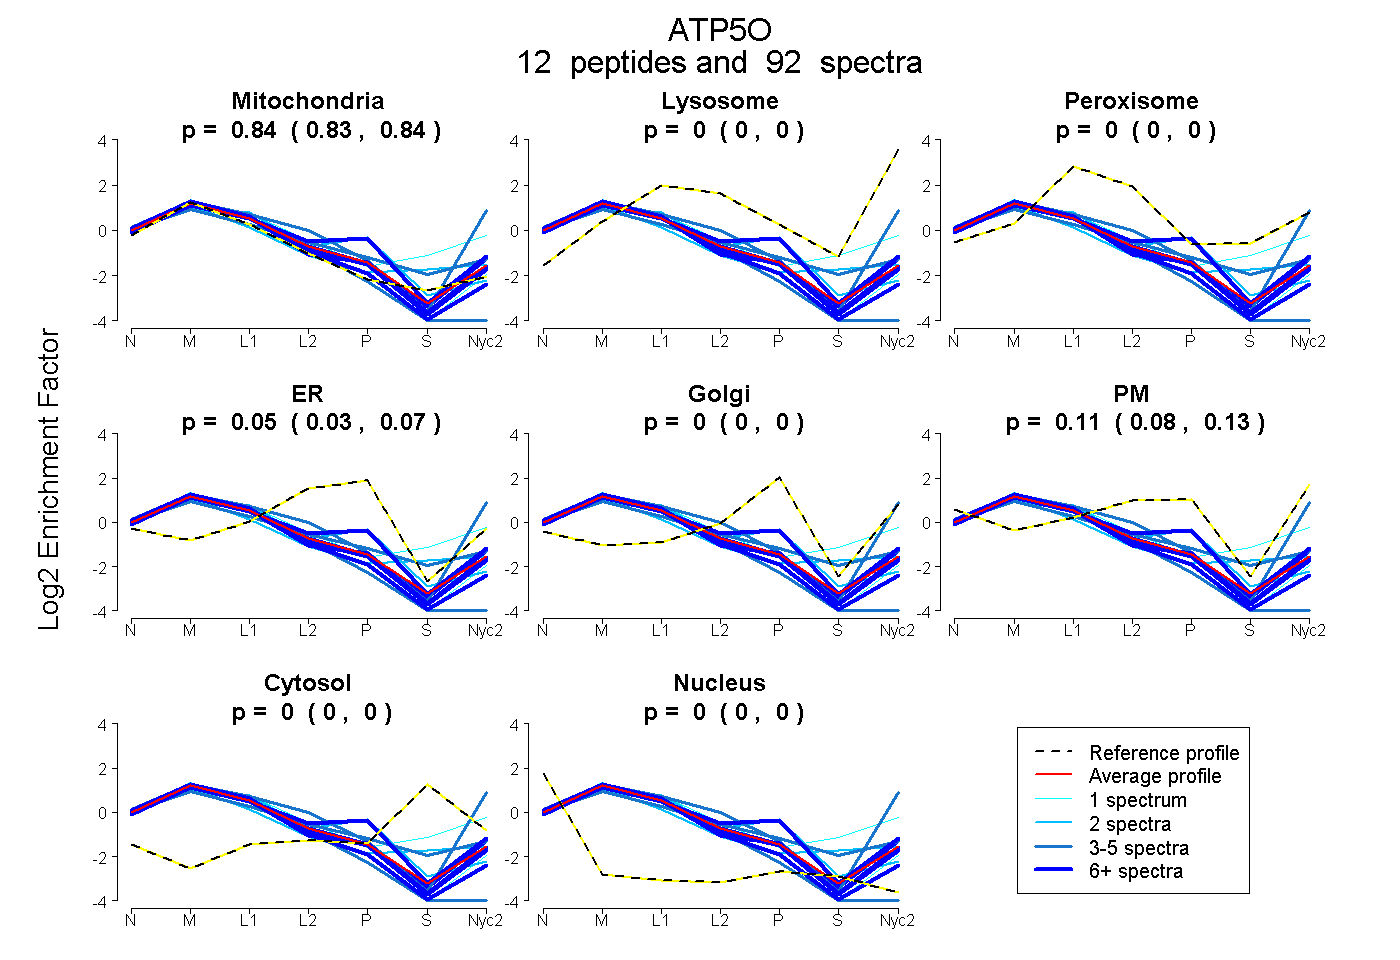
0.831 | 0.844
0.000 | 0.000
0.000 | 0.000
0.033 | 0.073
0.000 | 0.000
0.079 | 0.130
0.000 | 0.000
0.000 | 0.000
10peptides
spectra
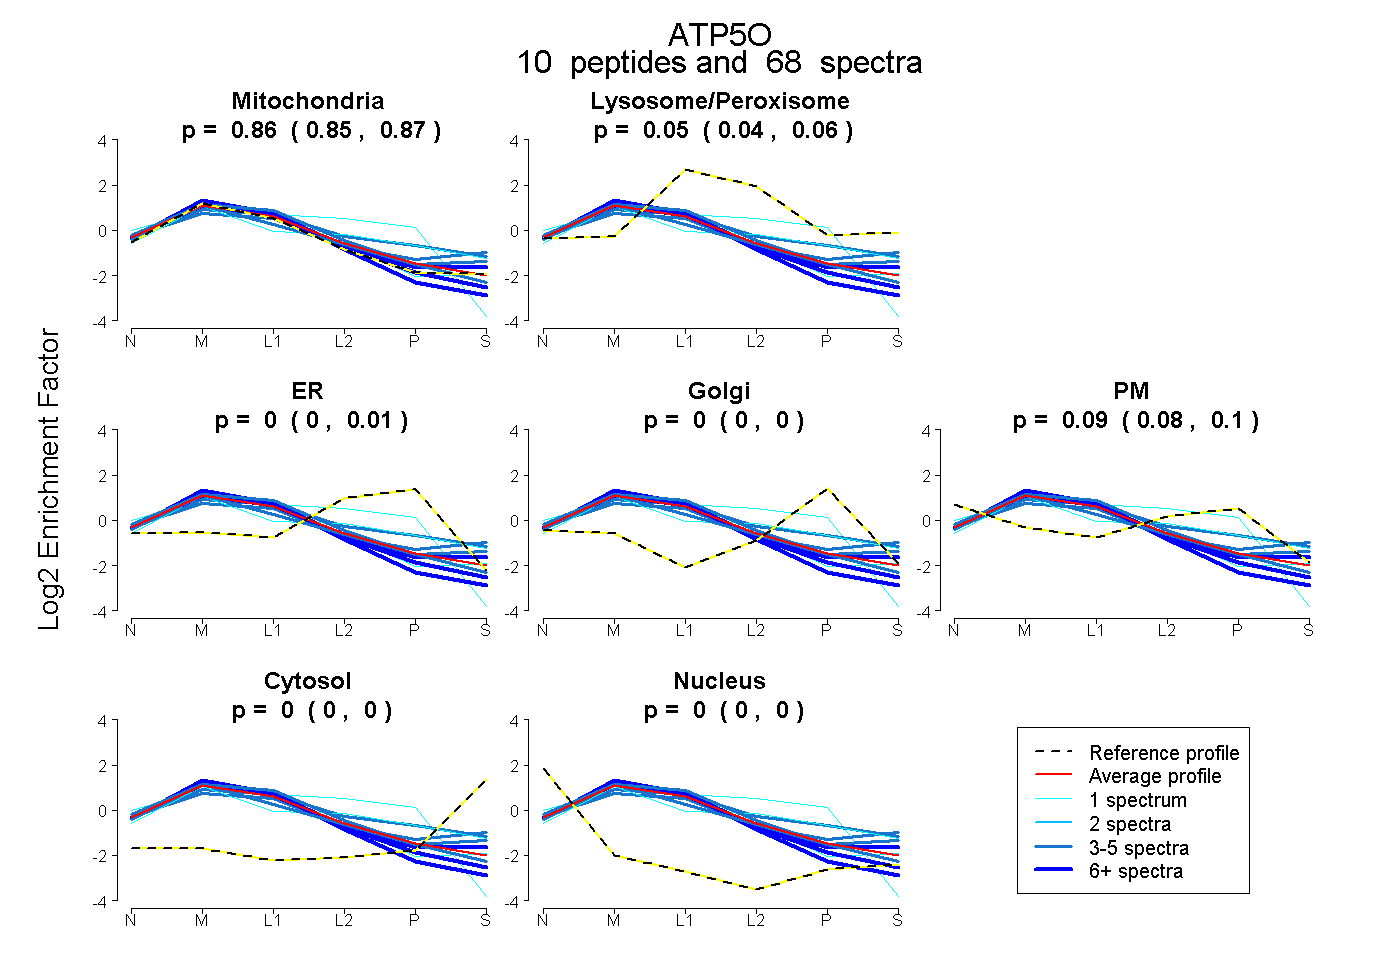
0.846 | 0.866
0.040 | 0.057
0.000 | 0.015
0.000 | 0.000
0.081 | 0.097
0.000 | 0.000
0.000 | 0.000
12peptides
spectra
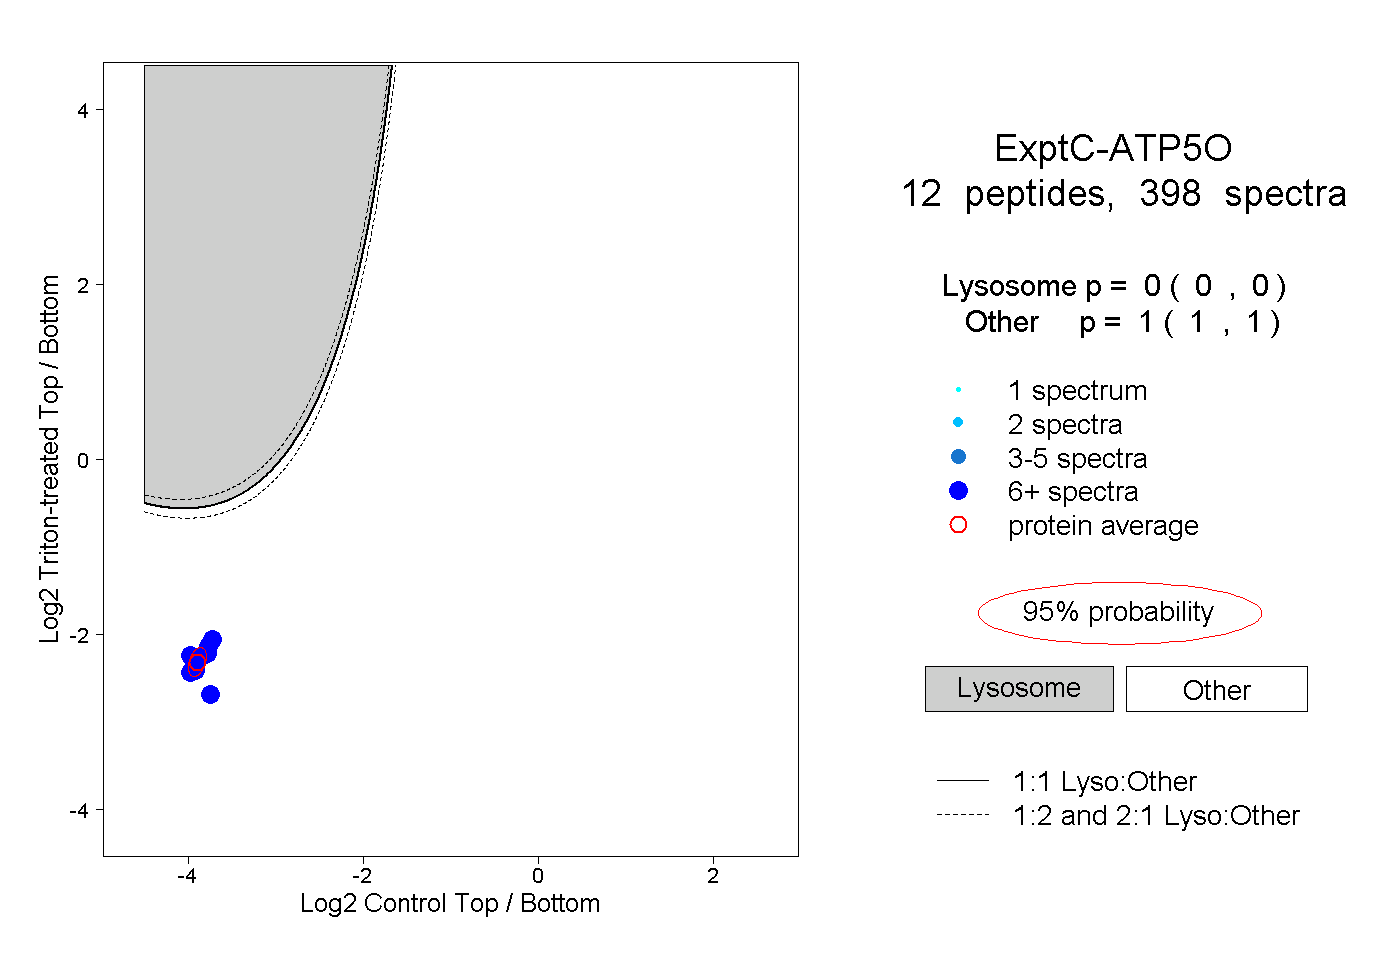
0.000 | 0.000
1.000 | 1.000
5peptides
spectra
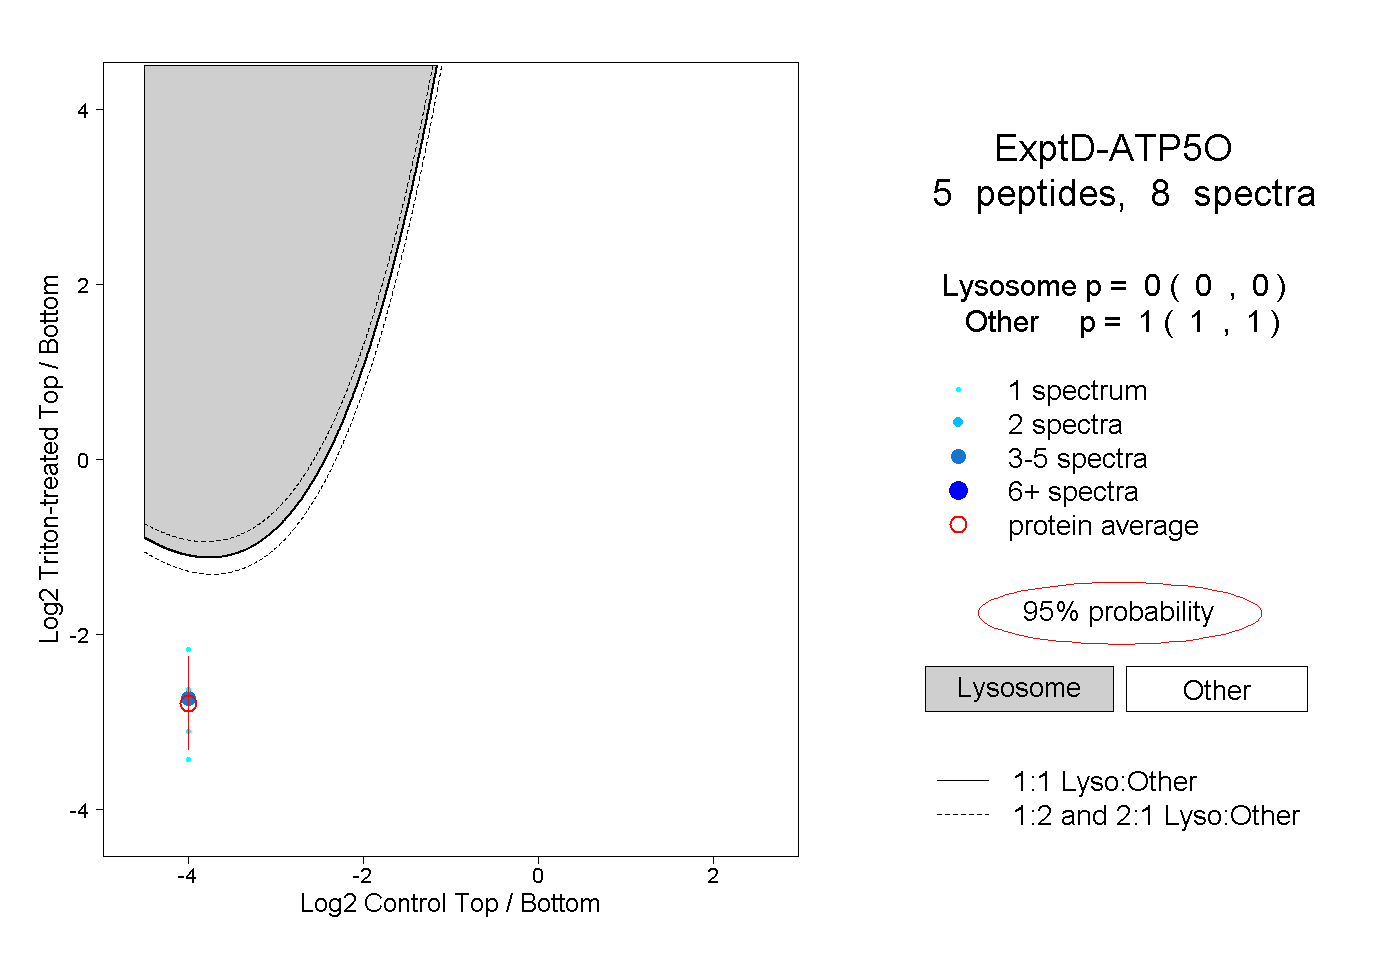
0.000 | 0.000
1.000 | 1.000