 27
27peptides
spectra
0.000 | 0.000
0.838 | 0.840
0.000 | 0.000
0.000 | 0.000
0.000 | 0.000
0.000 | 0.000
0.159 | 0.162
0.000 | 0.000
| Plot | Mito | Lyso | Perox | ER | Golgi | PM | Cytosol | Nucleus | |||||
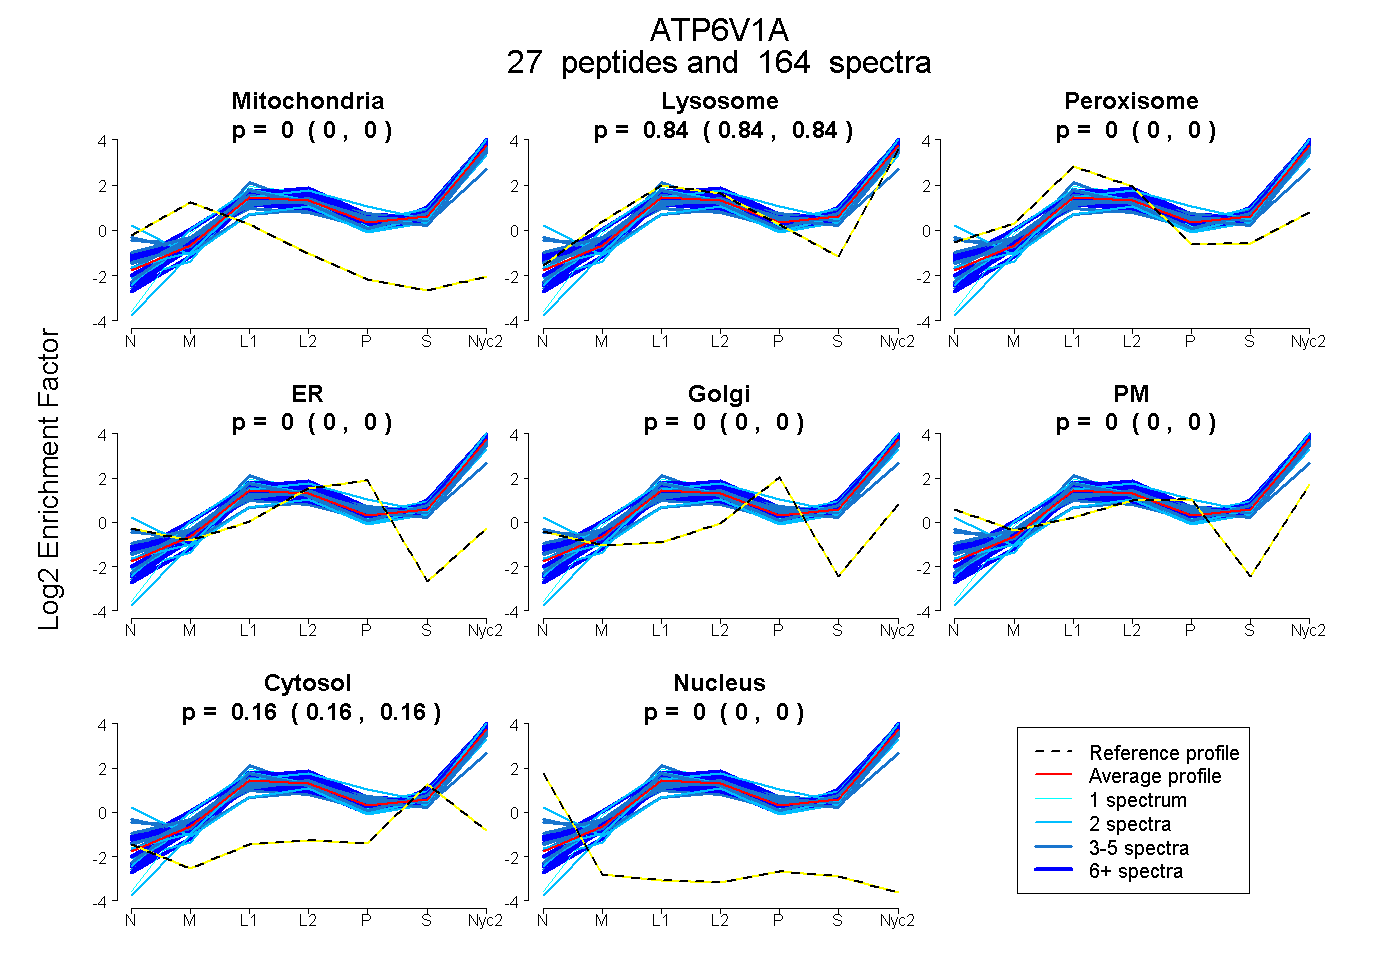
| Expt A |
27 peptides |
164 spectra |
|
0.000 0.000 | 0.000 |
0.839 0.838 | 0.840 |
0.000 0.000 | 0.000 |
0.000 0.000 | 0.000 |
0.000 0.000 | 0.000 |
0.000 0.000 | 0.000 |
0.161 0.159 | 0.162 |
0.000 0.000 | 0.000 |
| 8 spectra, LASFYER | 0.000 | 0.936 | 0.000 | 0.000 | 0.000 | 0.000 | 0.064 | 0.000 | ||
| 2 spectra, HFTEFVPLR | 0.000 | 0.875 | 0.000 | 0.000 | 0.000 | 0.000 | 0.125 | 0.000 | ||
| 3 spectra, VESIMK | 0.000 | 0.853 | 0.000 | 0.000 | 0.000 | 0.000 | 0.147 | 0.000 | ||
| 2 spectra, TVGMLSNMISFYDMAR | 0.000 | 0.906 | 0.000 | 0.000 | 0.000 | 0.000 | 0.094 | 0.000 | ||
| 5 spectra, WAEALR | 0.000 | 0.840 | 0.000 | 0.000 | 0.000 | 0.000 | 0.160 | 0.000 | ||
| 4 spectra, QVRPVTEK | 0.000 | 0.825 | 0.000 | 0.000 | 0.000 | 0.000 | 0.175 | 0.000 | ||
| 3 spectra, LAEMPADSGYPAYLGAR | 0.000 | 0.862 | 0.000 | 0.000 | 0.000 | 0.000 | 0.138 | 0.000 | ||
| 1 spectrum, ITWSIIR | 0.000 | 0.930 | 0.000 | 0.000 | 0.000 | 0.000 | 0.070 | 0.000 | ||
| 2 spectra, DDFLQQNGYTPYDR | 0.000 | 0.858 | 0.000 | 0.000 | 0.000 | 0.000 | 0.142 | 0.000 | ||
| 25 spectra, LPANHPLLTGQR | 0.000 | 0.863 | 0.000 | 0.000 | 0.000 | 0.000 | 0.137 | 0.000 | ||
| 2 spectra, TVISHSLSK | 0.000 | 0.594 | 0.000 | 0.000 | 0.000 | 0.165 | 0.241 | 0.000 | ||
| 4 spectra, VGHSELVGEIIR | 0.000 | 0.860 | 0.000 | 0.000 | 0.000 | 0.000 | 0.140 | 0.000 | ||
| 22 spectra, LSMVQVWPVR | 0.000 | 0.856 | 0.000 | 0.000 | 0.000 | 0.000 | 0.144 | 0.000 | ||
| 2 spectra, WEFIPSK | 0.000 | 0.892 | 0.000 | 0.000 | 0.000 | 0.000 | 0.108 | 0.000 | ||
| 2 spectra, EASIYTGITLSEYFR | 0.000 | 0.845 | 0.000 | 0.000 | 0.000 | 0.000 | 0.155 | 0.000 | ||
| 5 spectra, FCPFYK | 0.000 | 0.841 | 0.000 | 0.000 | 0.000 | 0.000 | 0.159 | 0.000 | ||
| 9 spectra, CLGNPER | 0.000 | 0.888 | 0.000 | 0.000 | 0.000 | 0.000 | 0.112 | 0.000 | ||
| 6 spectra, TALVANTSNMPVAAR | 0.000 | 0.889 | 0.000 | 0.000 | 0.000 | 0.000 | 0.111 | 0.000 | ||
| 5 spectra, YSNSDVIIYVGCGER | 0.000 | 0.820 | 0.000 | 0.000 | 0.000 | 0.000 | 0.180 | 0.000 | ||
| 4 spectra, DFPELTMEVDGK | 0.000 | 0.776 | 0.000 | 0.000 | 0.000 | 0.000 | 0.224 | 0.000 | ||
| 9 spectra, GNEMSEVLR | 0.000 | 0.804 | 0.000 | 0.000 | 0.000 | 0.000 | 0.196 | 0.000 | ||
| 13 spectra, IMLPPR | 0.000 | 0.786 | 0.000 | 0.000 | 0.000 | 0.000 | 0.214 | 0.000 | ||
| 3 spectra, ADYAQLLEDMQNAFR | 0.000 | 0.781 | 0.000 | 0.000 | 0.000 | 0.000 | 0.219 | 0.000 | ||
| 6 spectra, ALDEYYDK | 0.000 | 0.782 | 0.000 | 0.000 | 0.000 | 0.000 | 0.218 | 0.000 | ||
| 3 spectra, AVETTAQSDNK | 0.000 | 0.883 | 0.000 | 0.000 | 0.000 | 0.000 | 0.117 | 0.000 | ||
| 4 spectra, EHMGEILYK | 0.000 | 0.557 | 0.000 | 0.000 | 0.000 | 0.181 | 0.262 | 0.000 | ||
| 10 spectra, GVNVSALSR | 0.000 | 0.839 | 0.000 | 0.000 | 0.000 | 0.000 | 0.161 | 0.000 |
| Plot | Mito | Lyso or Perox | ER | Golgi | PM | Cytosol | Nucleus | ||||||
| Expt B |
13 peptides |
33 spectra |
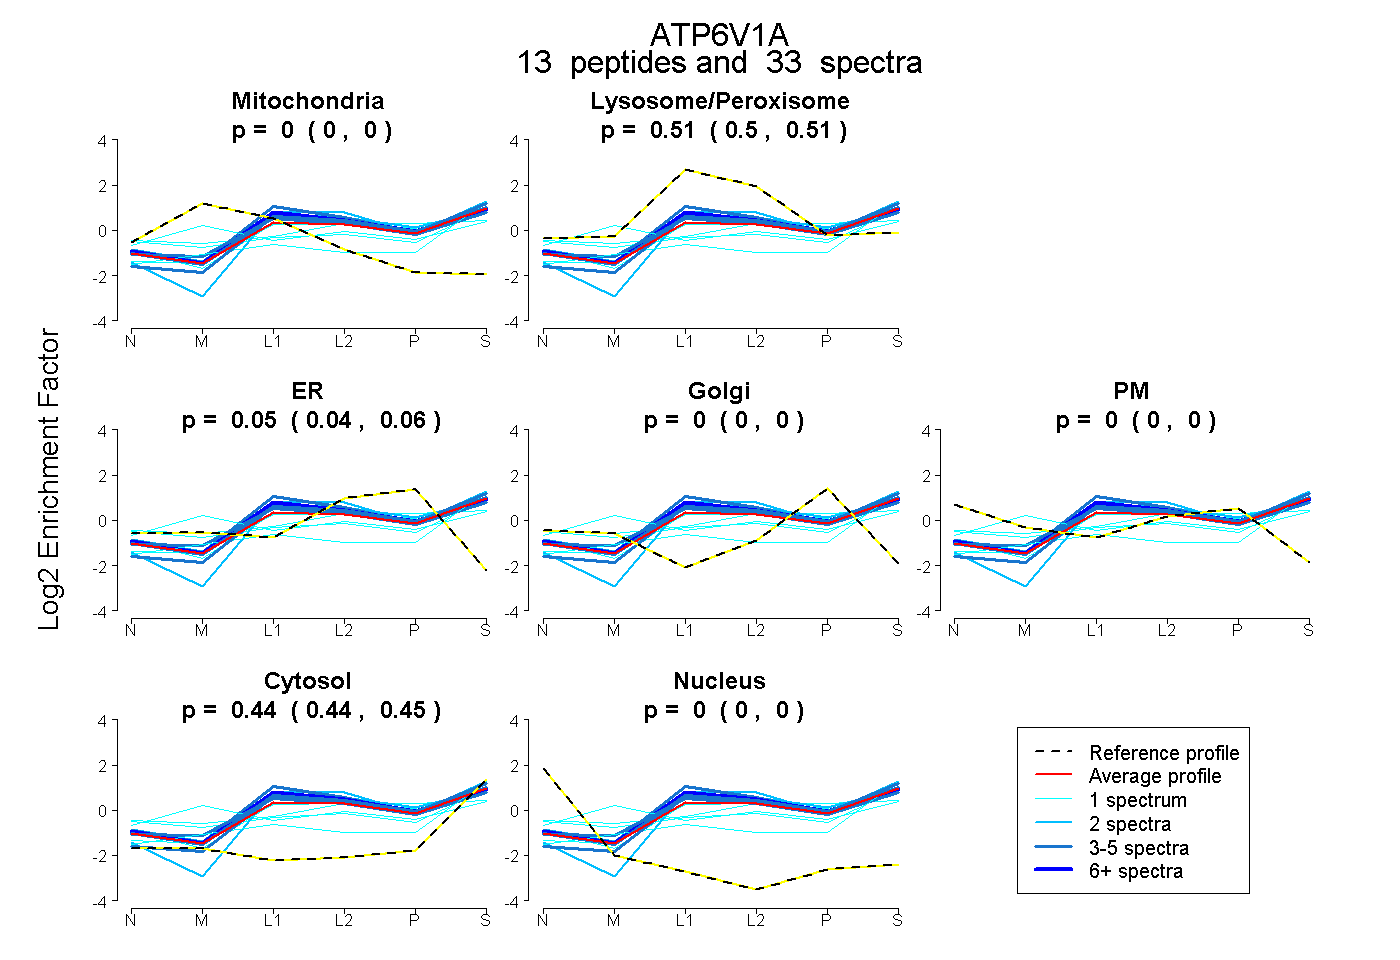 |
0.000 0.000 | 0.000 |
0.507 0.498 | 0.515 |
0.050 0.042 | 0.056 |
0.000 0.000 | 0.000 |
0.000 0.000 | 0.000 |
0.443 0.437 | 0.447 |
0.000 0.000 | 0.000 |
|||
| Plot | Lyso | Other | |||||||||||
| Expt C |
28 peptides |
386 spectra |
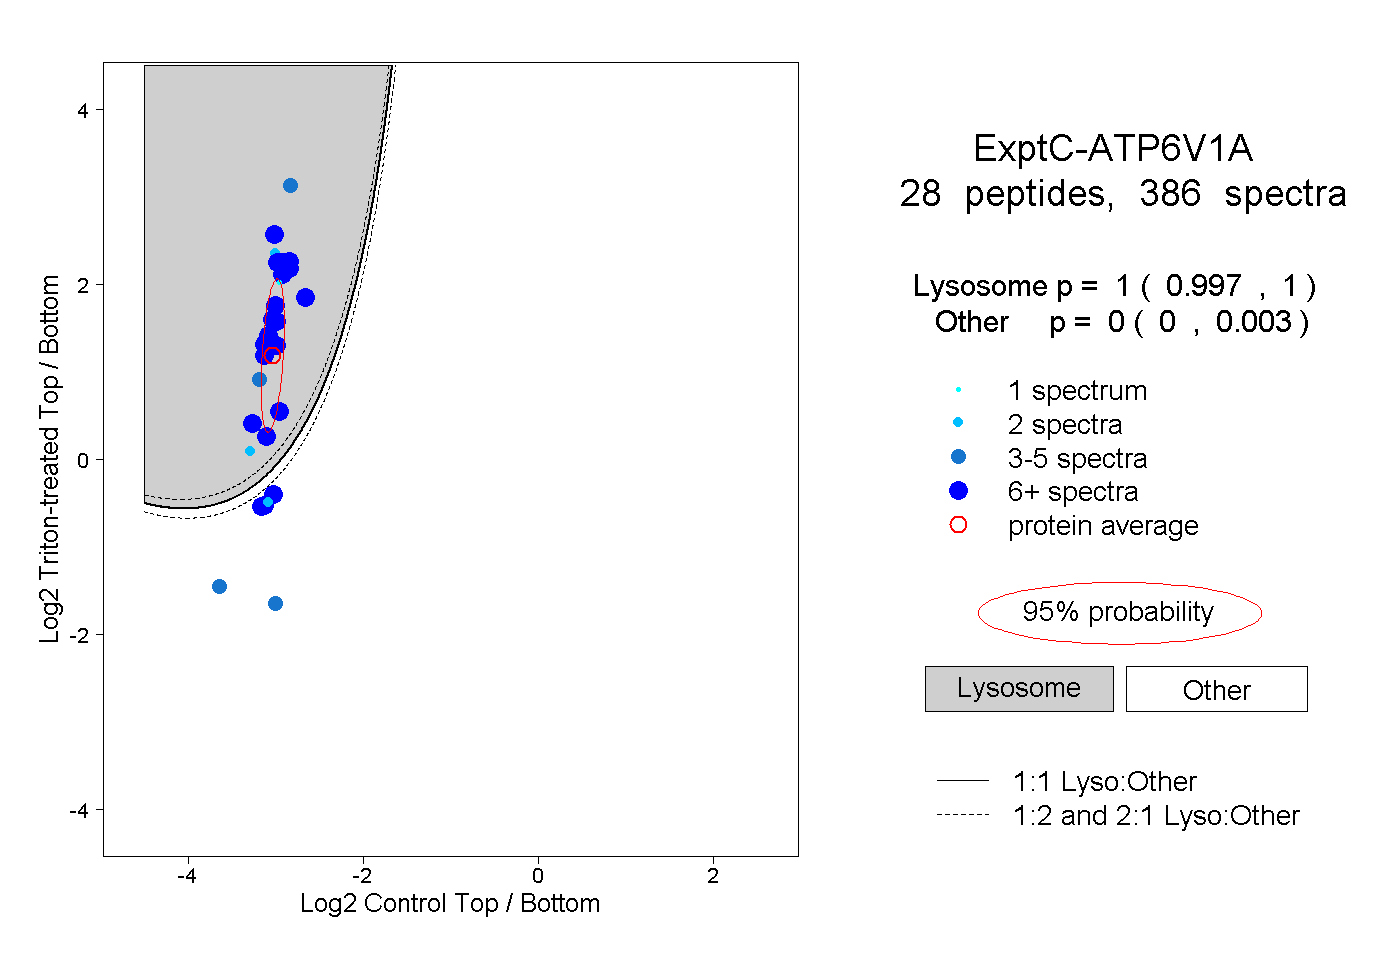 |
1.000 0.997 | 1.000 |
0.000 0.000 | 0.003 |
||||||||
| Plot | Lyso | Other | |||||||||||
| Expt D |
9 peptides |
16 spectra |
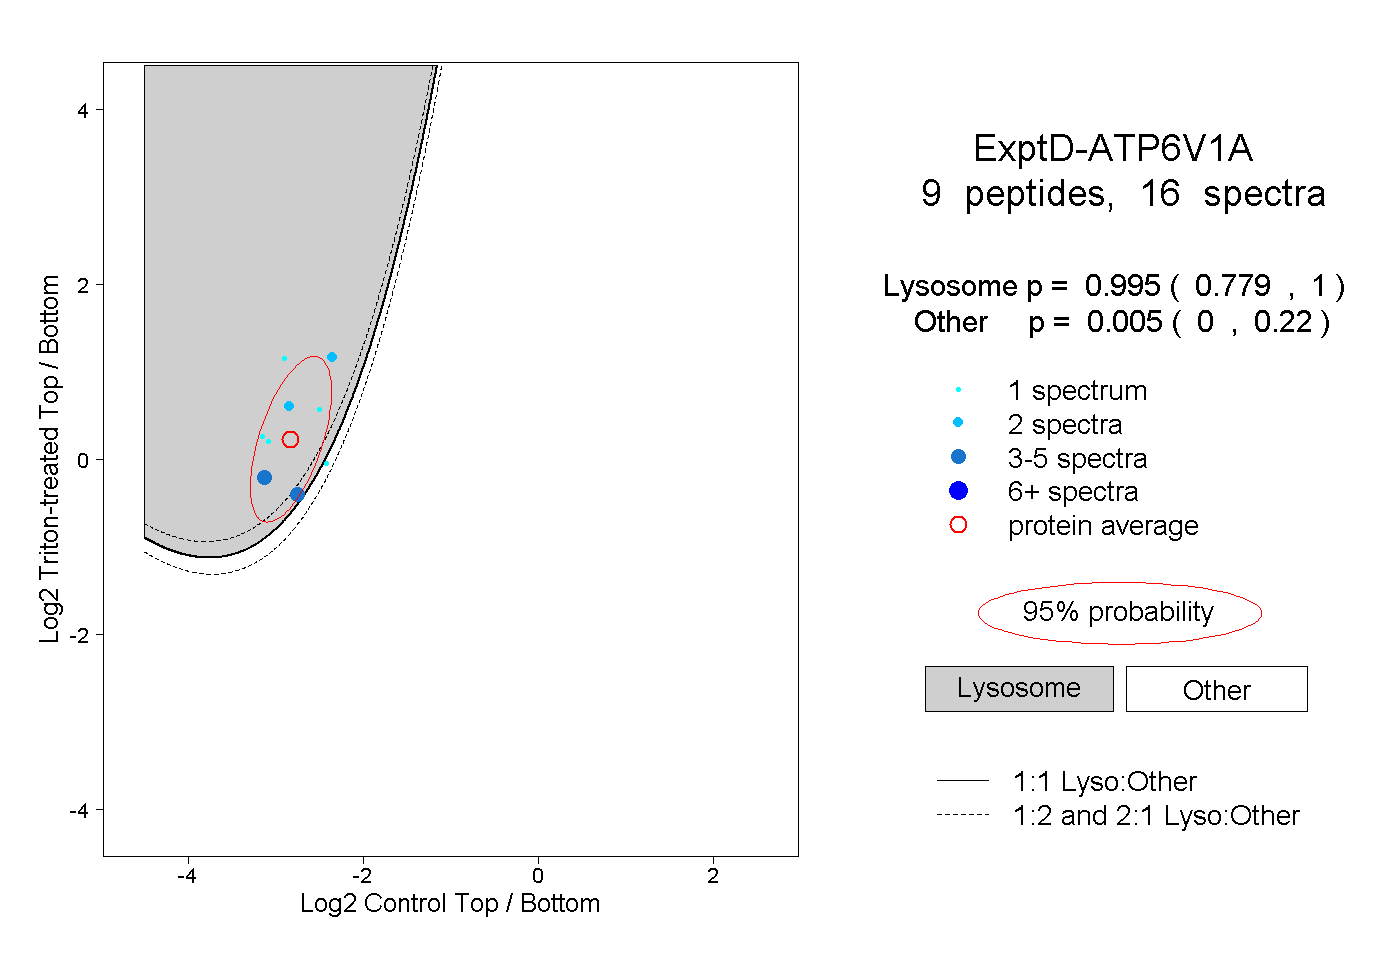 |
0.995 0.779 | 1.000 |
0.005 0.000 | 0.220 |