 27
27peptides
spectra
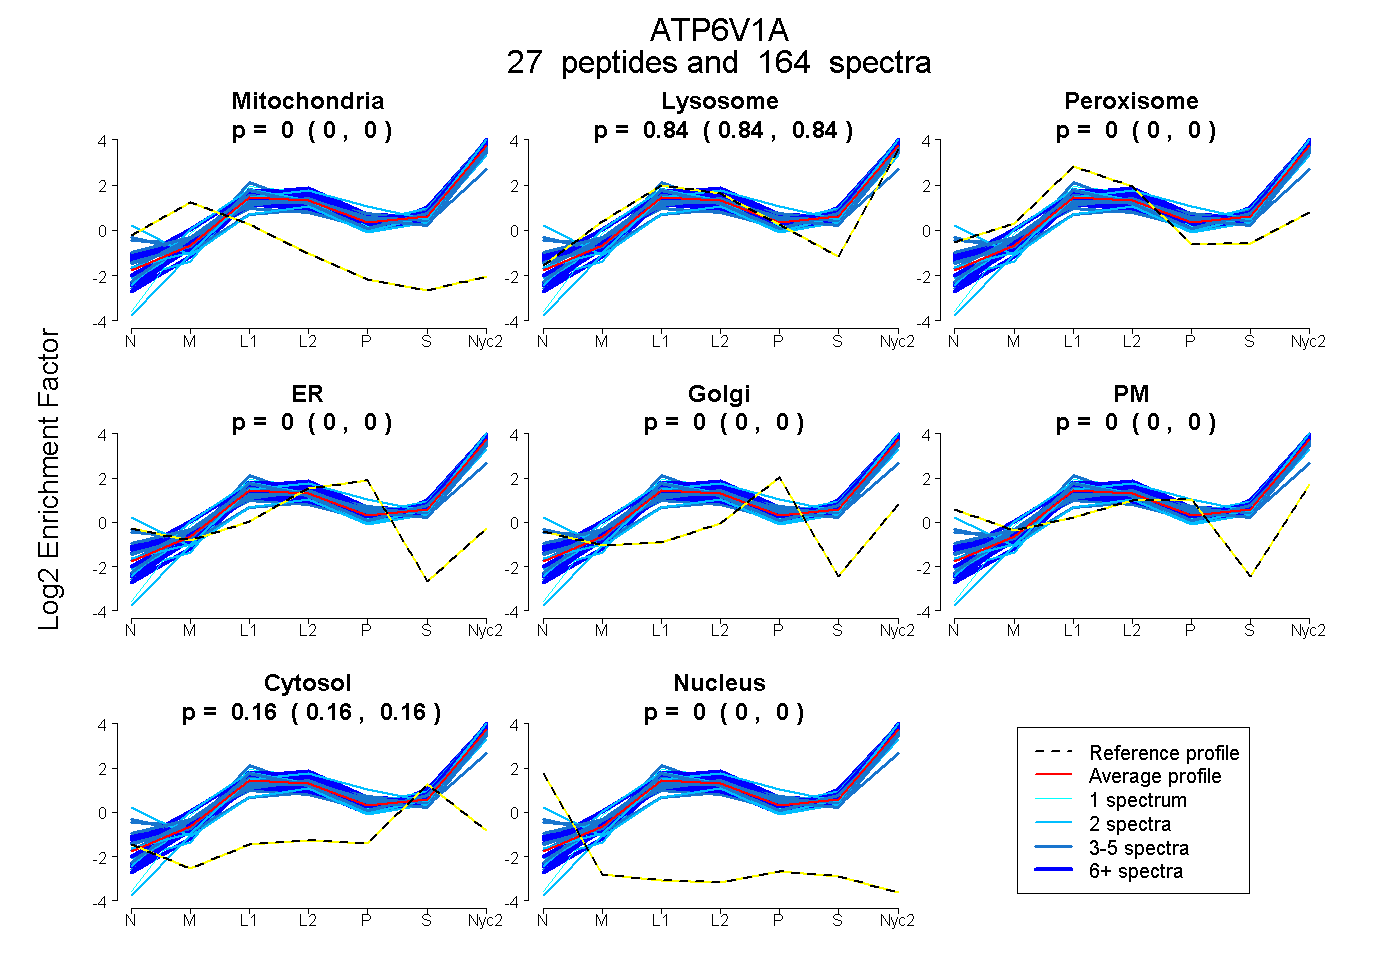
0.000 | 0.000
0.838 | 0.840
0.000 | 0.000
0.000 | 0.000
0.000 | 0.000
0.000 | 0.000
0.159 | 0.162
0.000 | 0.000
13peptides
spectra
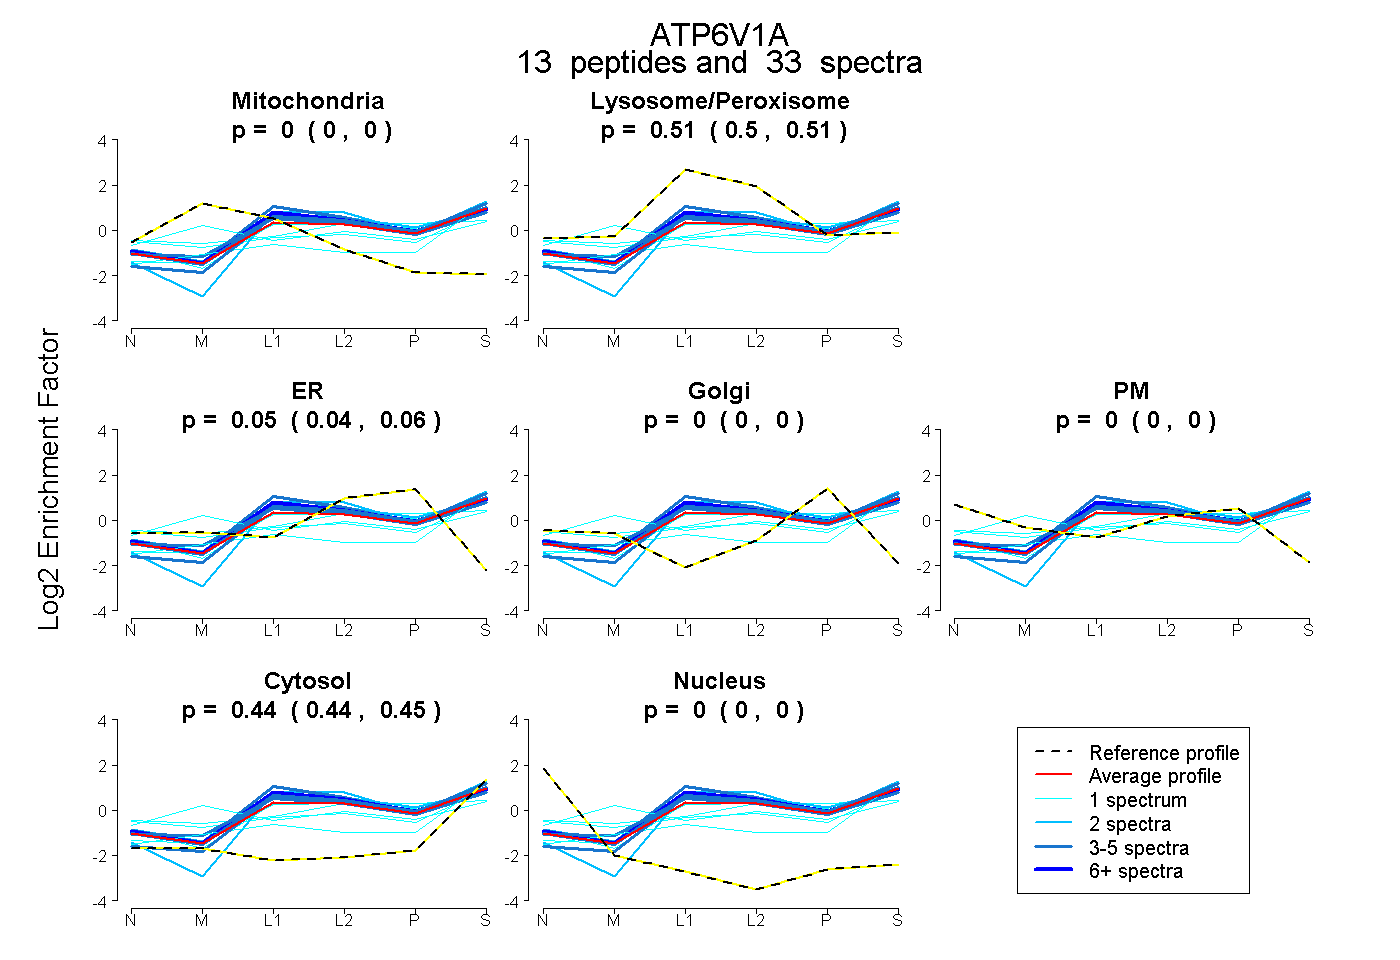
0.000 | 0.000
0.498 | 0.515
0.042 | 0.056
0.000 | 0.000
0.000 | 0.000
0.437 | 0.447
0.000 | 0.000
28peptides
spectra
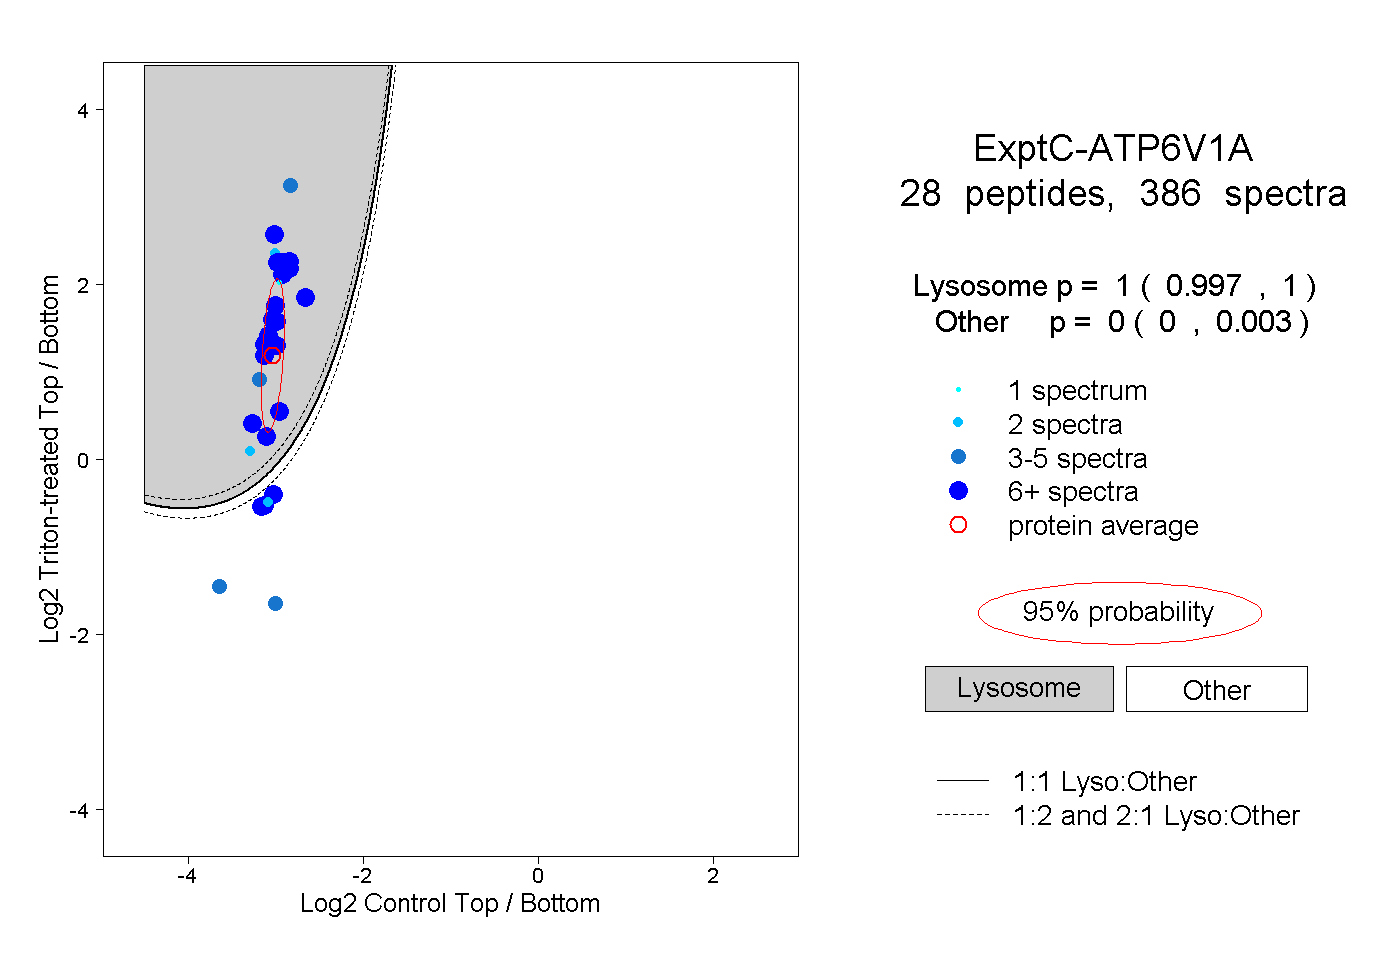
0.997 | 1.000
0.000 | 0.003
9peptides
spectra
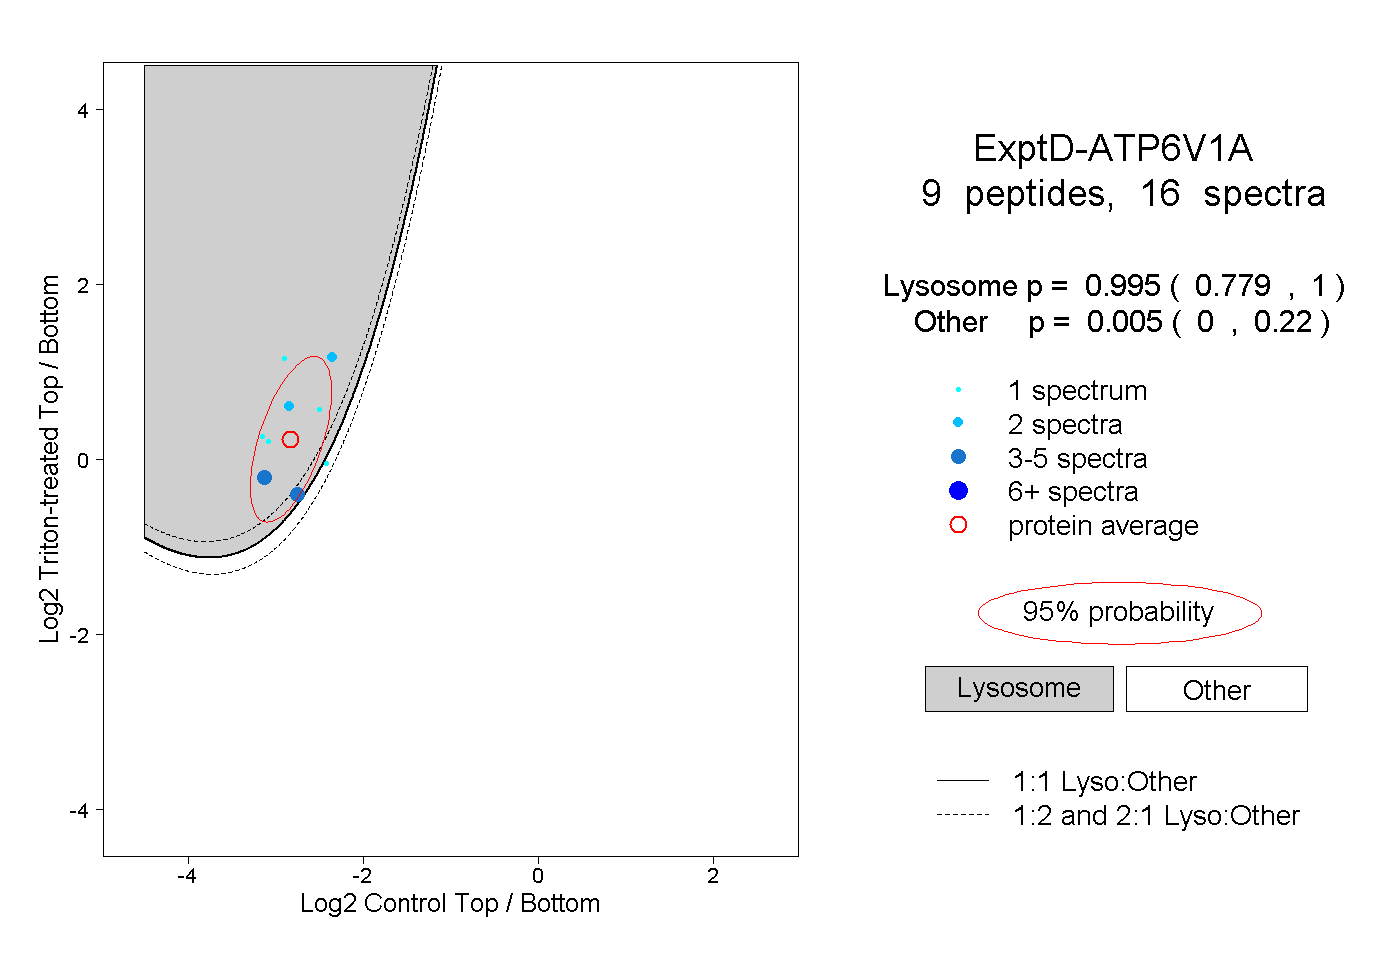
0.779 | 1.000
0.000 | 0.220