11
11peptides
spectra
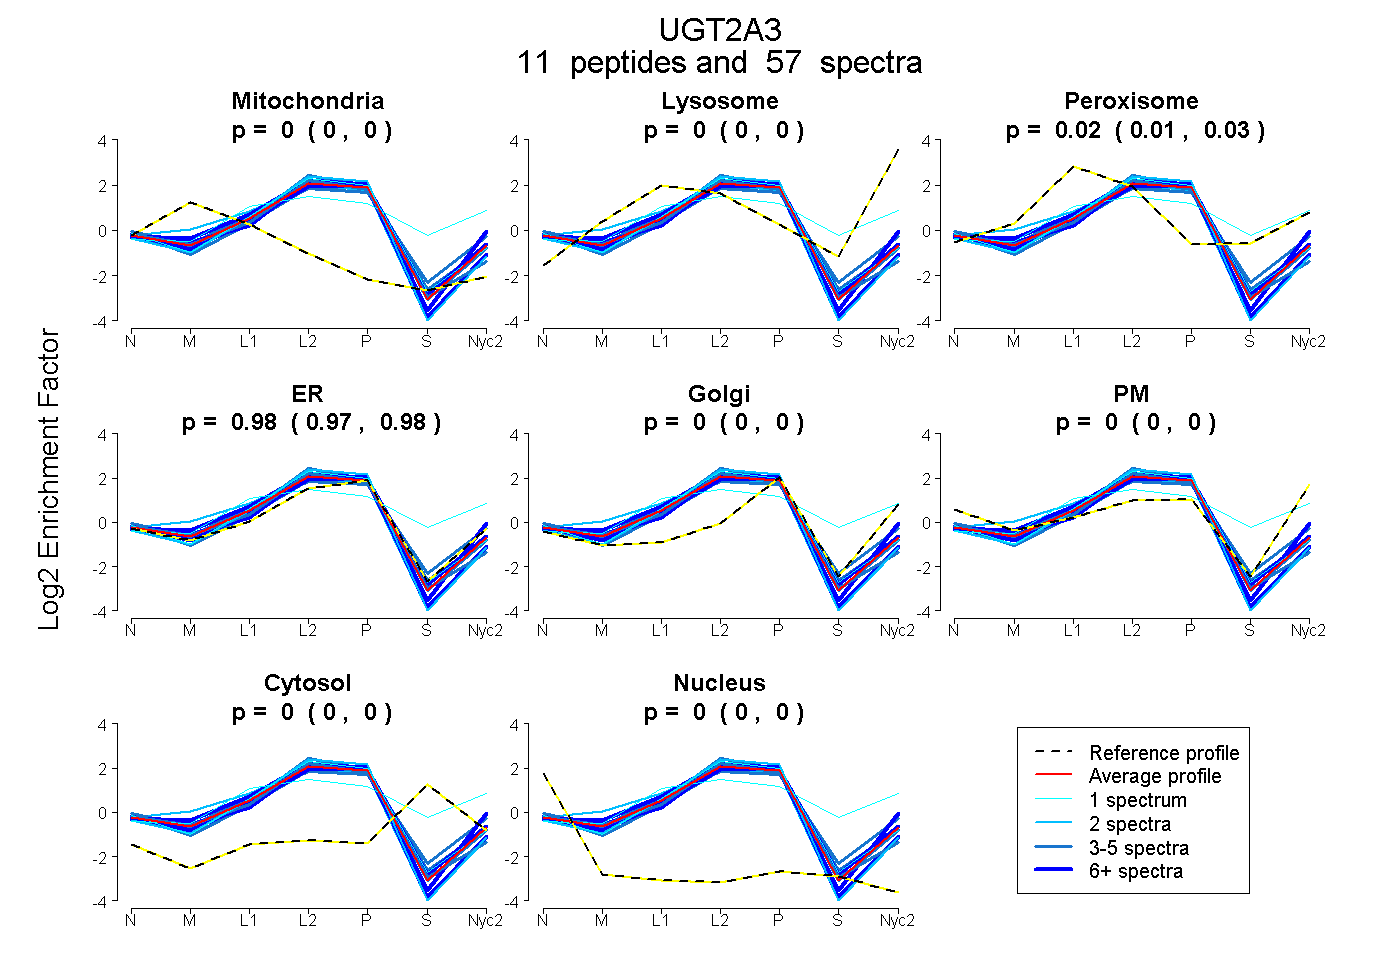
0.000 | 0.000
0.000 | 0.000
0.014 | 0.026
0.973 | 0.985
0.000 | 0.000
0.000 | 0.000
0.000 | 0.000
0.000 | 0.000
8peptides
spectra
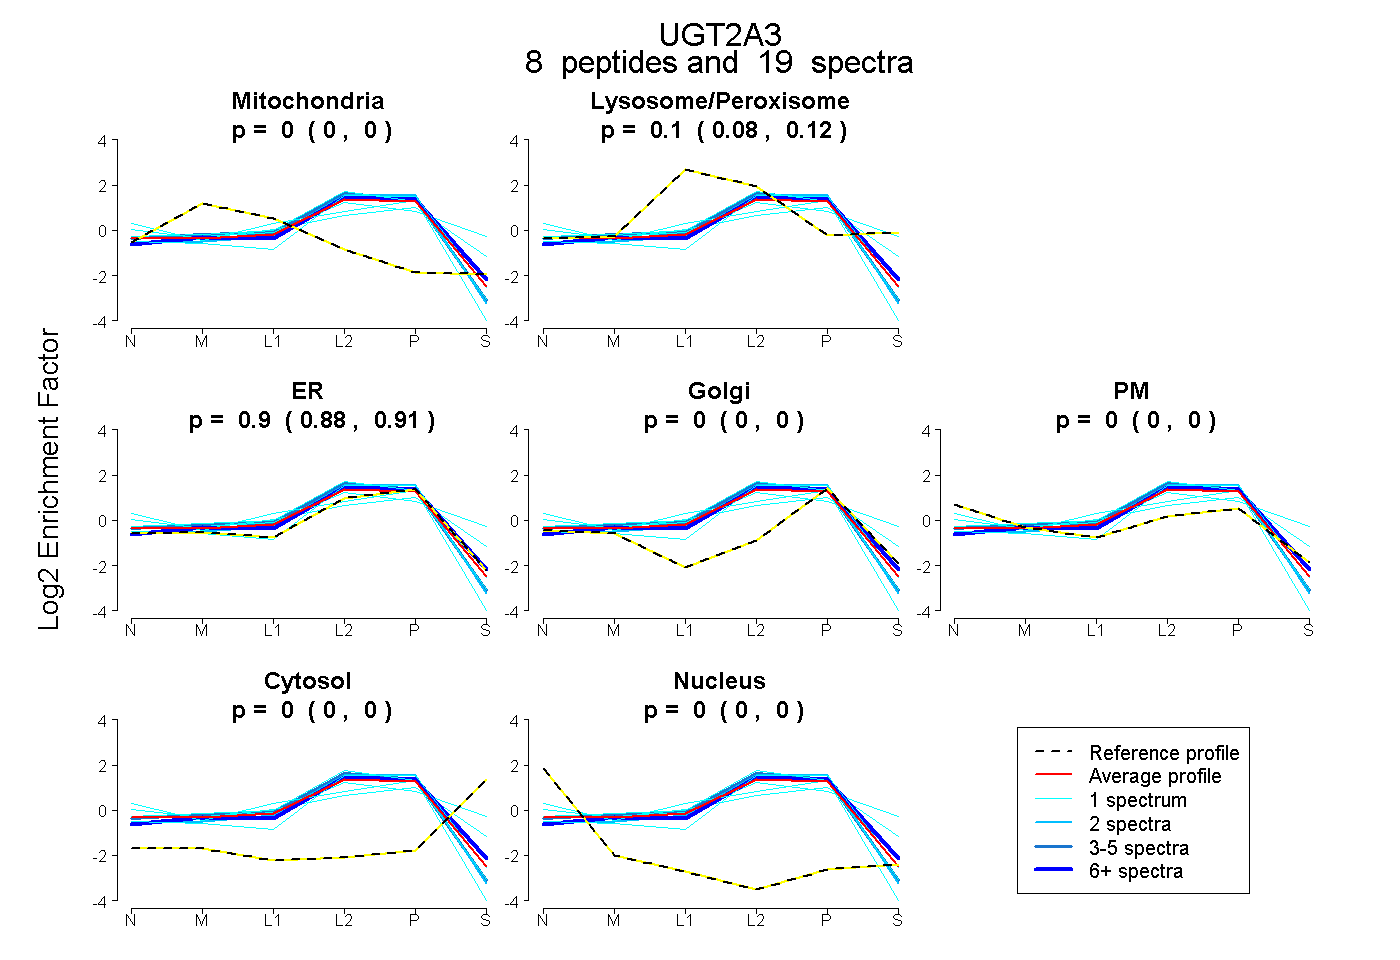
0.000 | 0.000
0.083 | 0.121
0.877 | 0.914
0.000 | 0.000
0.000 | 0.000
0.000 | 0.000
0.000 | 0.000