 11
11peptides
spectra
0.000 | 0.000
0.000 | 0.000
0.014 | 0.026
0.973 | 0.985
0.000 | 0.000
0.000 | 0.000
0.000 | 0.000
0.000 | 0.000
| Plot | Mito | Lyso | Perox | ER | Golgi | PM | Cytosol | Nucleus | |||||
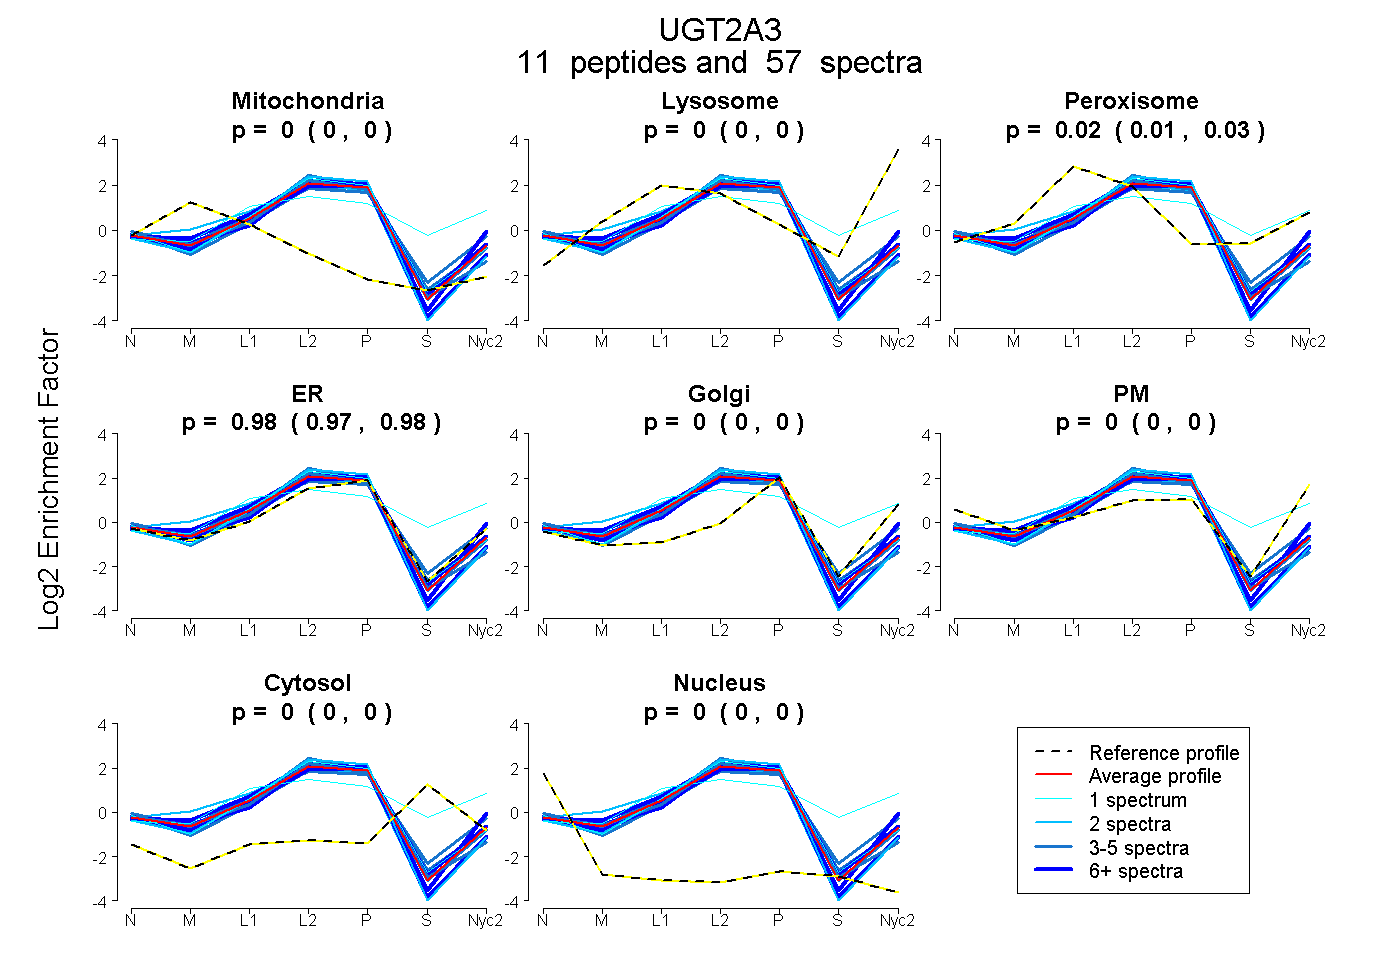
| Expt A |
11 peptides |
57 spectra |
|
0.000 0.000 | 0.000 |
0.000 0.000 | 0.000 |
0.021 0.014 | 0.026 |
0.979 0.973 | 0.985 |
0.000 0.000 | 0.000 |
0.000 0.000 | 0.000 |
0.000 0.000 | 0.000 |
0.000 0.000 | 0.000 |
| 3 spectra, ILNWIPQNDLLGHPK | 0.000 | 0.000 | 0.006 | 0.994 | 0.000 | 0.000 | 0.000 | 0.000 | ||
| 2 spectra, AEIWLIR | 0.098 | 0.000 | 0.000 | 0.902 | 0.000 | 0.000 | 0.000 | 0.000 | ||
| 2 spectra, VAINTMTSADLLSALR | 0.000 | 0.000 | 0.000 | 1.000 | 0.000 | 0.000 | 0.000 | 0.000 | ||
| 4 spectra, TLGRPTTFCK | 0.034 | 0.000 | 0.000 | 0.966 | 0.000 | 0.000 | 0.000 | 0.000 | ||
| 1 spectrum, YPSIIIDQSK | 0.000 | 0.198 | 0.310 | 0.327 | 0.034 | 0.000 | 0.131 | 0.000 | ||
| 1 spectrum, VLVWPCDMSHWLNLK | 0.000 | 0.000 | 0.036 | 0.964 | 0.000 | 0.000 | 0.000 | 0.000 | ||
| 6 spectra, FSMGYSMEK | 0.000 | 0.044 | 0.014 | 0.942 | 0.000 | 0.000 | 0.000 | 0.000 | ||
| 3 spectra, AVINEPSYK | 0.000 | 0.000 | 0.151 | 0.849 | 0.000 | 0.000 | 0.000 | 0.000 | ||
| 4 spectra, ANLIASALAQIPQK | 0.000 | 0.000 | 0.000 | 1.000 | 0.000 | 0.000 | 0.000 | 0.000 | ||
| 7 spectra, TILEELAAR | 0.000 | 0.000 | 0.000 | 1.000 | 0.000 | 0.000 | 0.000 | 0.000 | ||
| 24 spectra, KPATLGPNTR | 0.000 | 0.000 | 0.013 | 0.987 | 0.000 | 0.000 | 0.000 | 0.000 |
| Plot | Mito | Lyso or Perox | ER | Golgi | PM | Cytosol | Nucleus | ||||||
| Expt B |
8 peptides |
19 spectra |
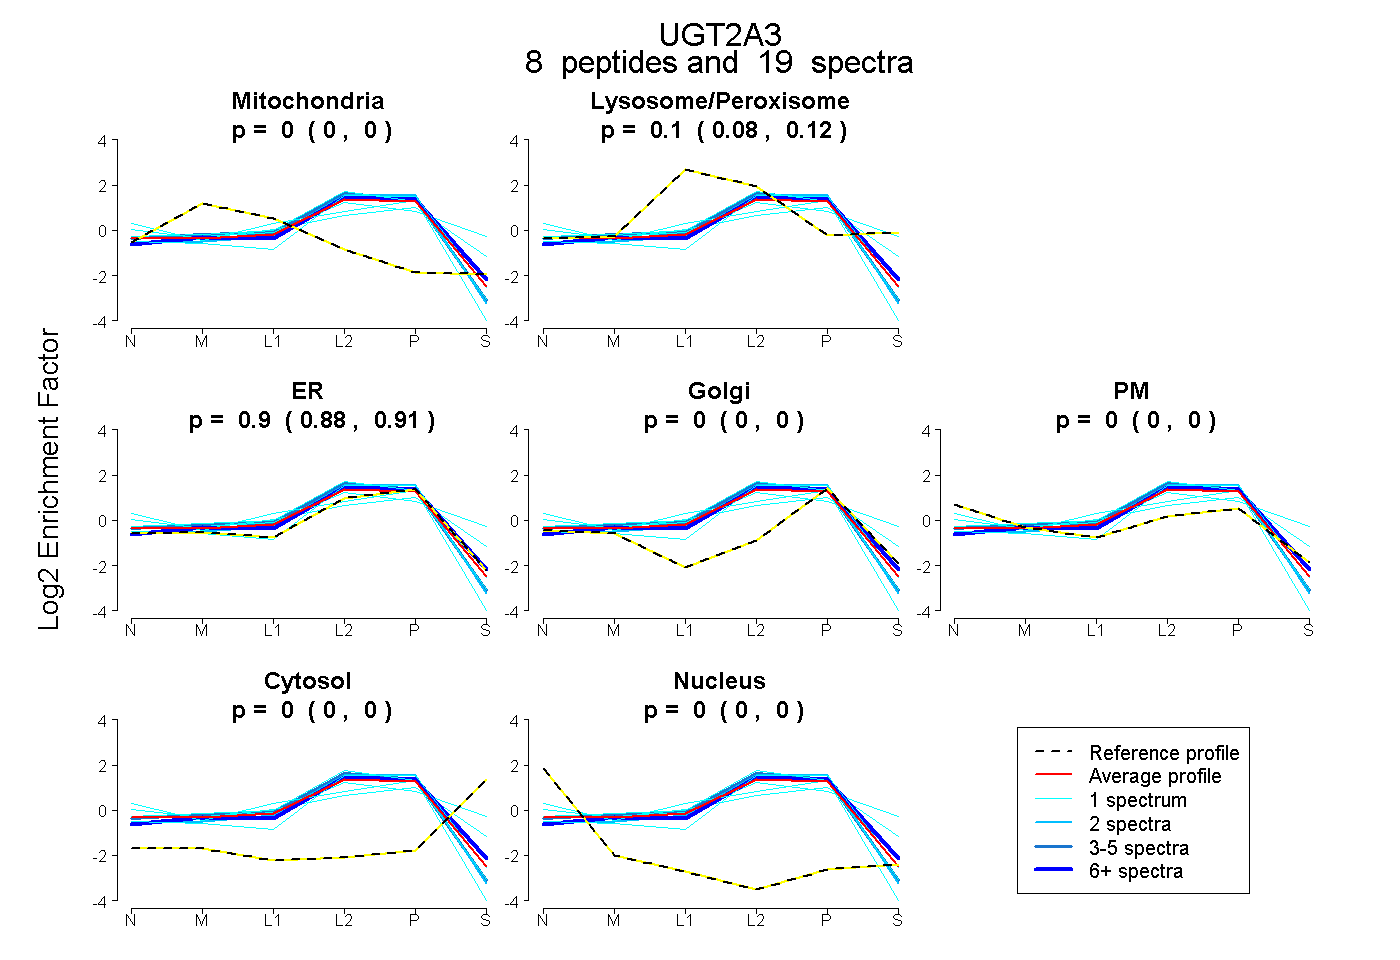 |
0.000 0.000 | 0.000 |
0.103 0.083 | 0.121 |
0.897 0.877 | 0.914 |
0.000 0.000 | 0.000 |
0.000 0.000 | 0.000 |
0.000 0.000 | 0.000 |
0.000 0.000 | 0.000 |
|||
| Plot | Lyso | Other | |||||||||||
| Expt C |
9 peptides |
90 spectra |
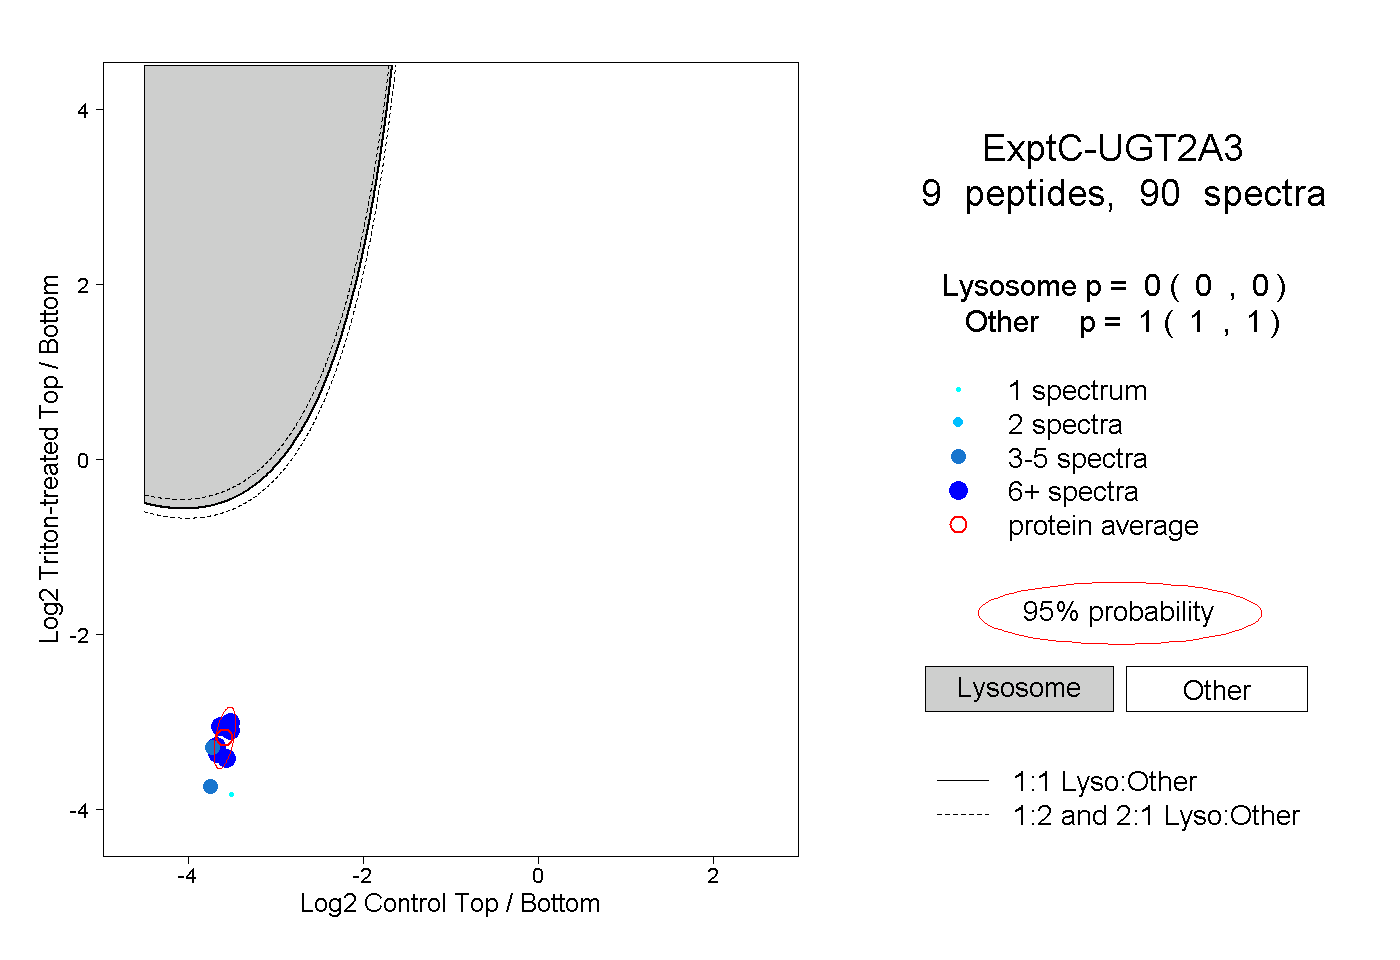 |
0.000 0.000 | 0.000 |
1.000 1.000 | 1.000 |
||||||||
| Plot | Lyso | Other | |||||||||||
| Expt D |
4 peptides |
10 spectra |
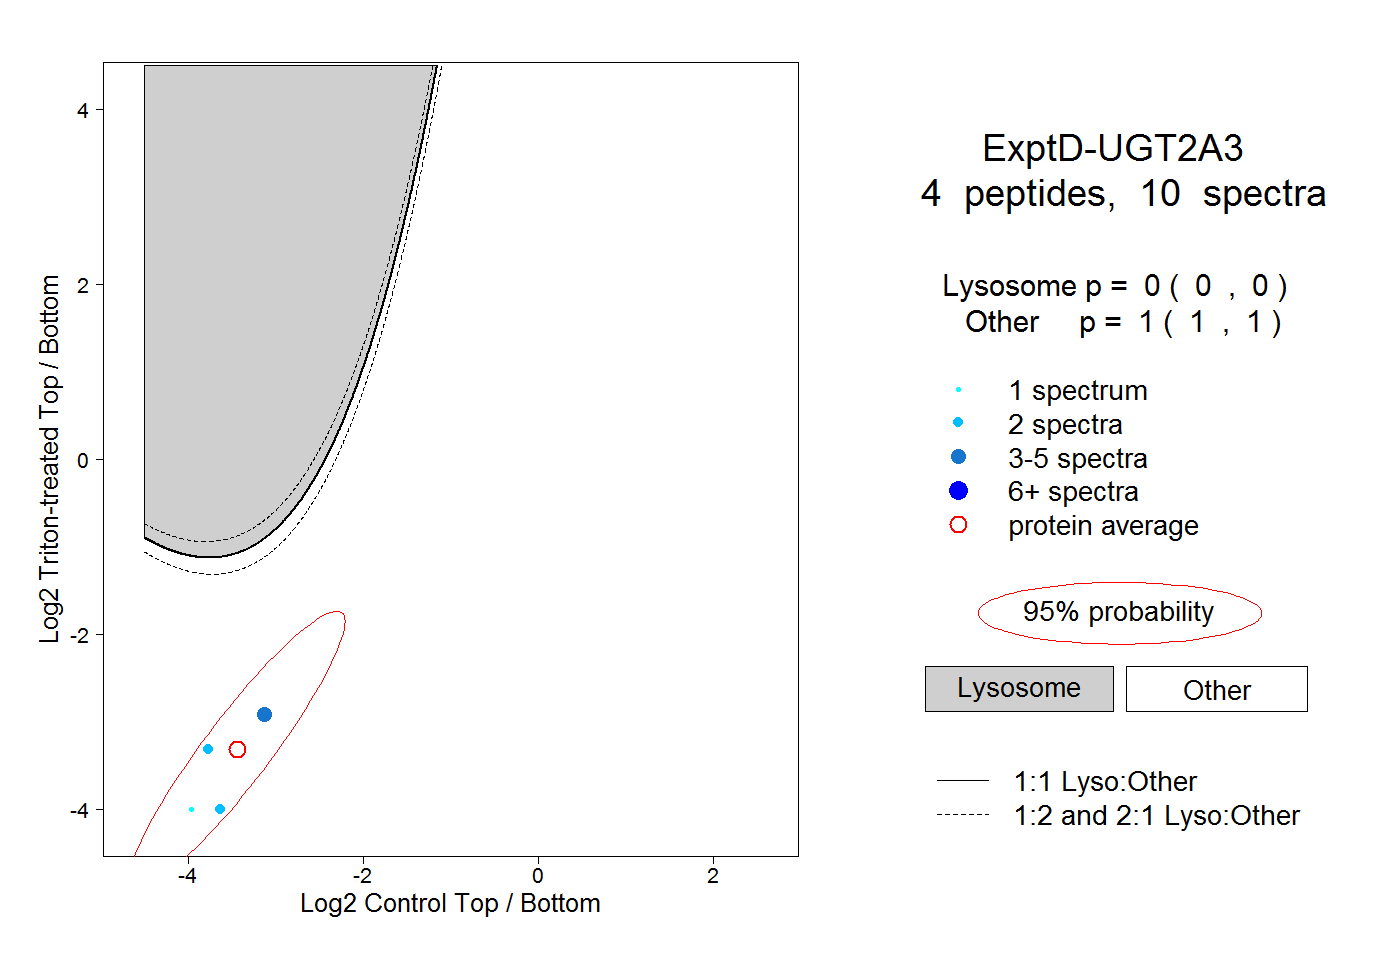 |
0.000 0.000 | 0.000 |
1.000 1.000 | 1.000 |