 13
13peptides
spectra
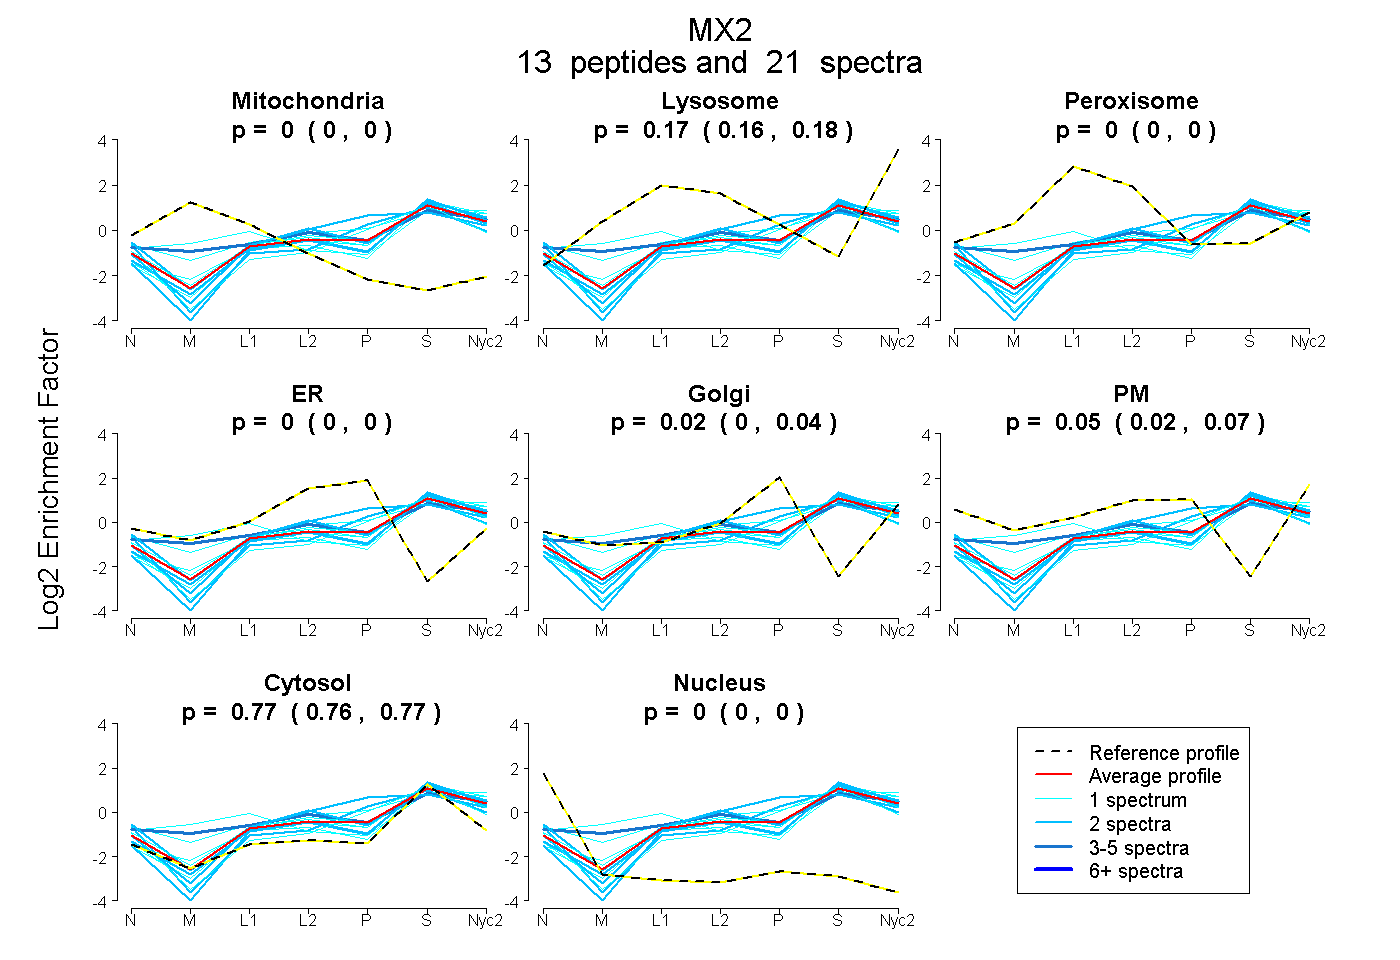
0.000 | 0.000
0.155 | 0.179
0.000 | 0.000
0.000 | 0.000
0.000 | 0.042
0.019 | 0.070
0.755 | 0.774
0.000 | 0.000
5peptides
spectra
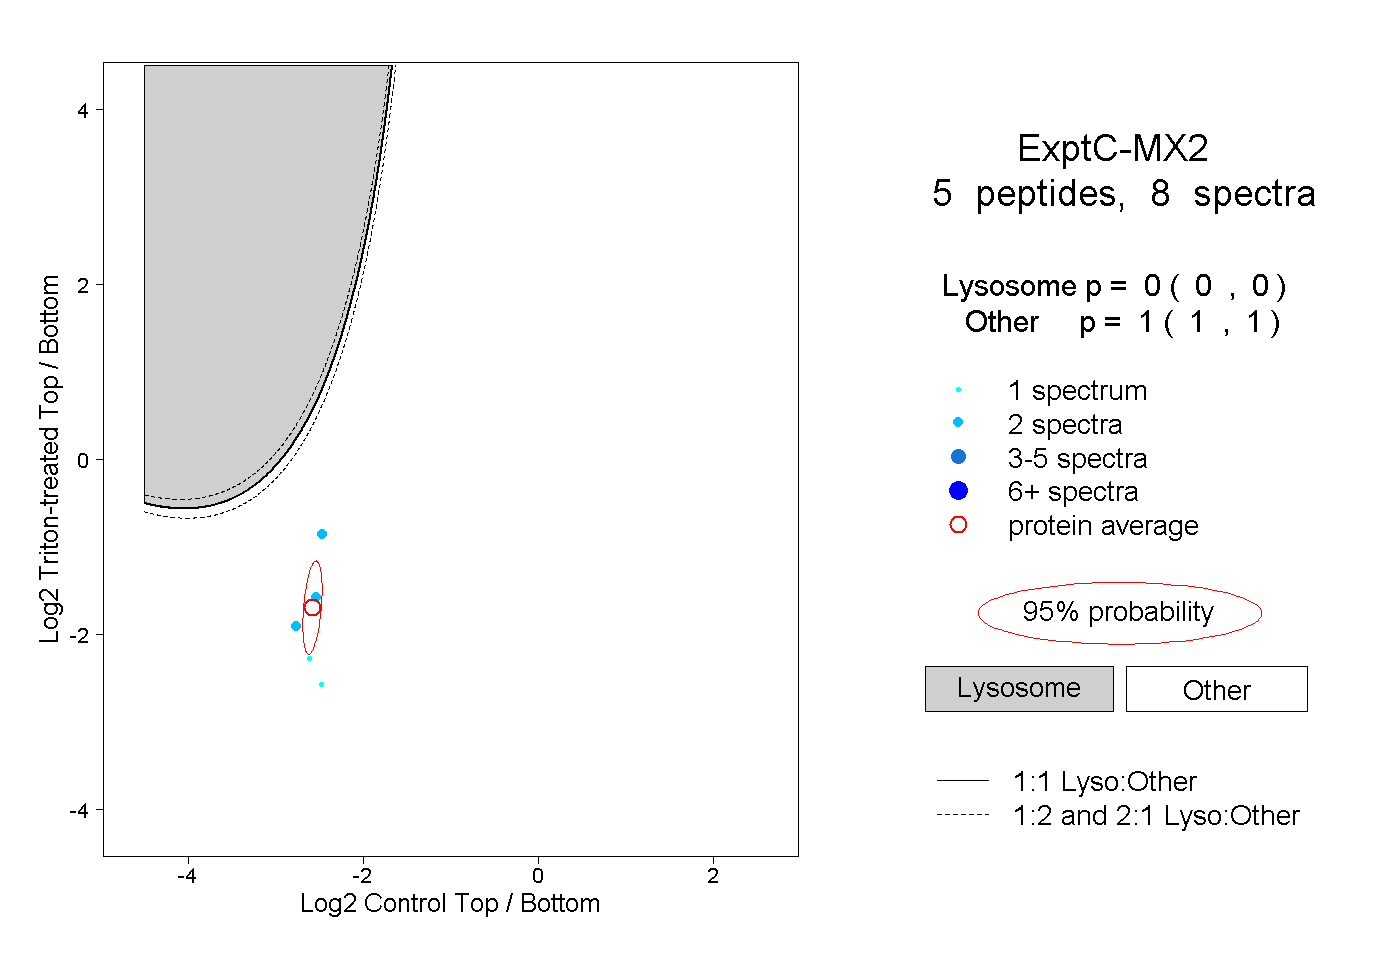
0.000 | 0.000
1.000 | 1.000
| Plot | Mito | Lyso | Perox | ER | Golgi | PM | Cytosol | Nucleus | |||||
| Expt A |
13 peptides |
21 spectra |
|
0.000 0.000 | 0.000 |
0.168 0.155 | 0.179 |
0.000 0.000 | 0.000 |
0.000 0.000 | 0.000 |
0.019 0.000 | 0.042 |
0.048 0.019 | 0.070 |
0.765 0.755 | 0.774 |
0.000 0.000 | 0.000 |
||
| Plot | Lyso | Other | |||||||||||
| Expt C |
5 peptides |
8 spectra |
|
0.000 0.000 | 0.000 |
1.000 1.000 | 1.000 |