STE2
[ENSRNOP00000002680]
Main page
| | | Plot |
Mito |
Lyso |
|
Perox |
ER |
Golgi |
PM |
Cytosol |
Nucleus |
|
| Expt A |
 21
21
peptides |
346
spectra |
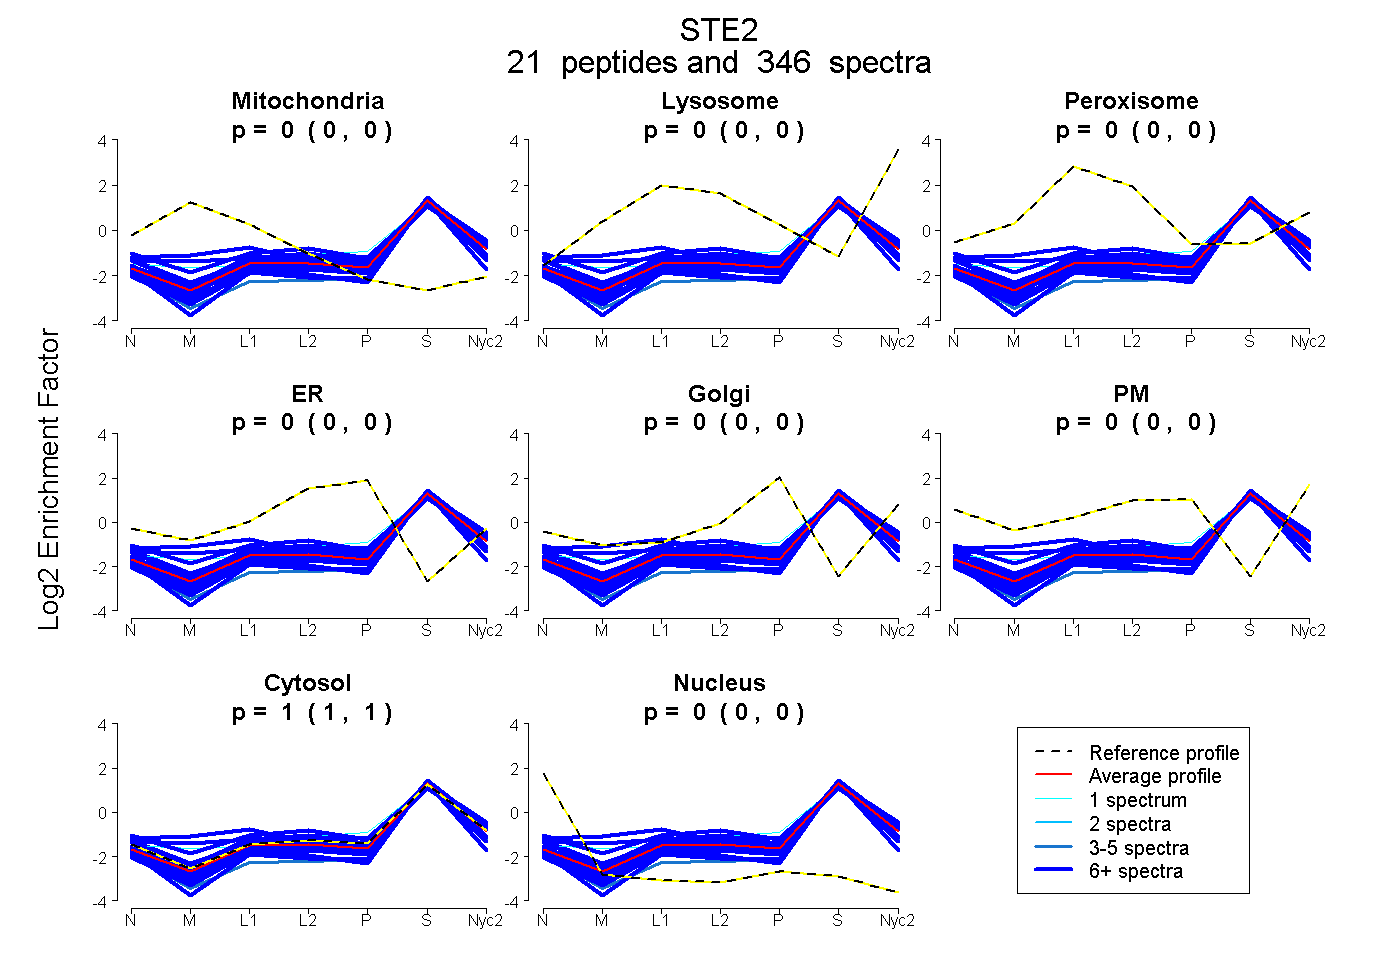 |
0.000
0.000 | 0.000 |
0.000
0.000 | 0.000 |
|
0.000
0.000 | 0.000 |
0.000
0.000 | 0.000 |
0.000
0.000 | 0.000 |
0.000
0.000 | 0.000 |
1.000
1.000 | 1.000 |
0.000
0.000 | 0.000 |
|
| | | Plot |
Mito |
|
Lyso or Perox |
|
ER |
Golgi |
PM |
Cytosol |
Nucleus |
|
| Expt B |
14
peptides |
63
spectra |
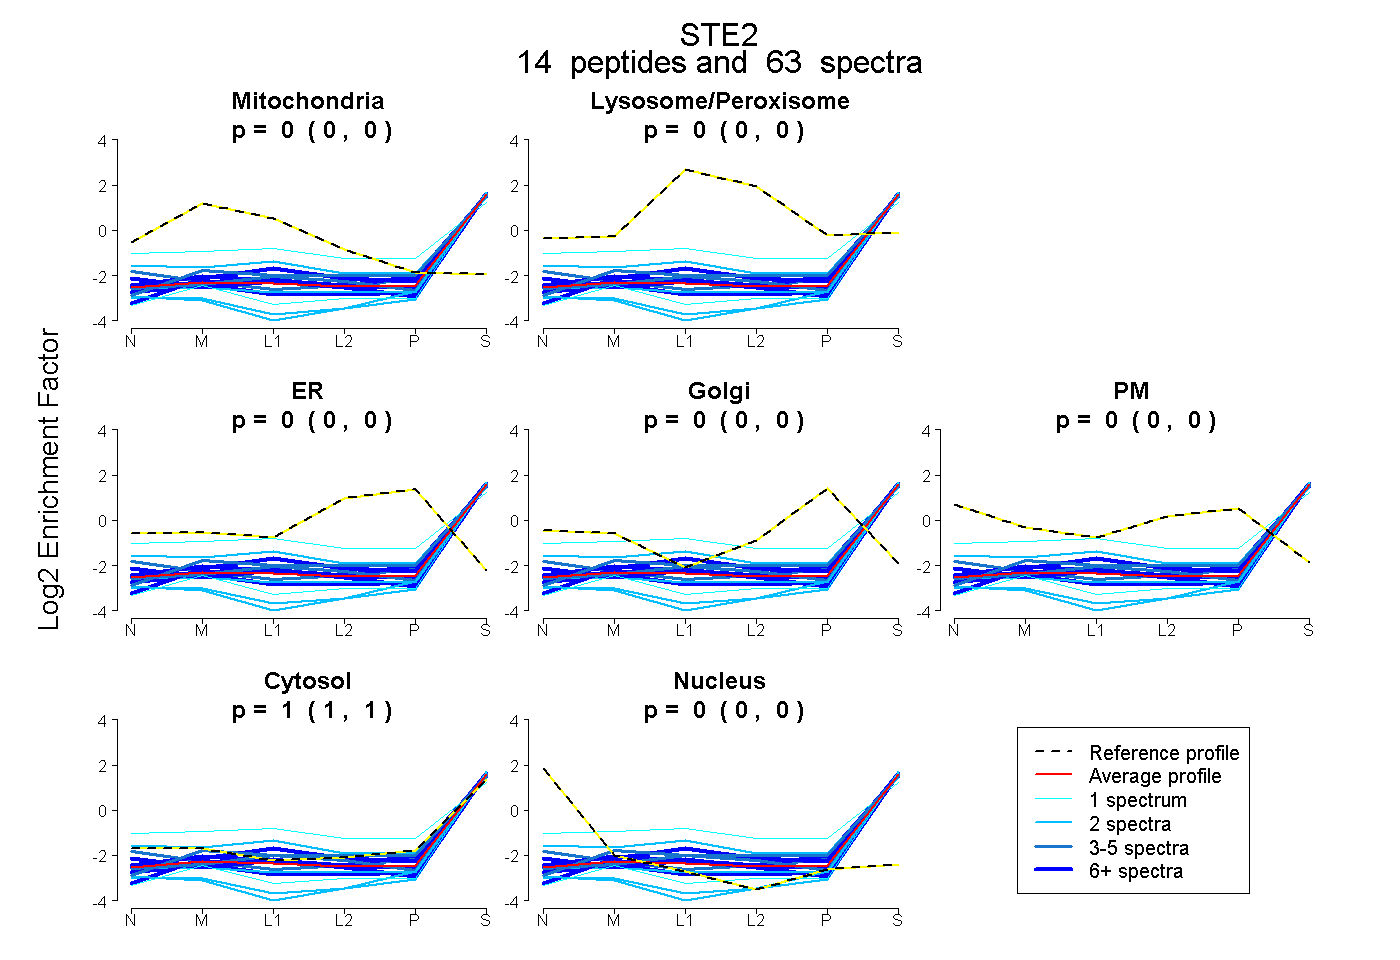 |
0.000
0.000 | 0.000 |
|
0.000
0.000 | 0.000 |
|
0.000
0.000 | 0.000 |
0.000
0.000 | 0.000 |
0.000
0.000 | 0.000 |
1.000
1.000 | 1.000 |
0.000
0.000 | 0.000 |
|
| | | Plot |
|
Lyso |
|
|
|
|
|
|
|
Other |
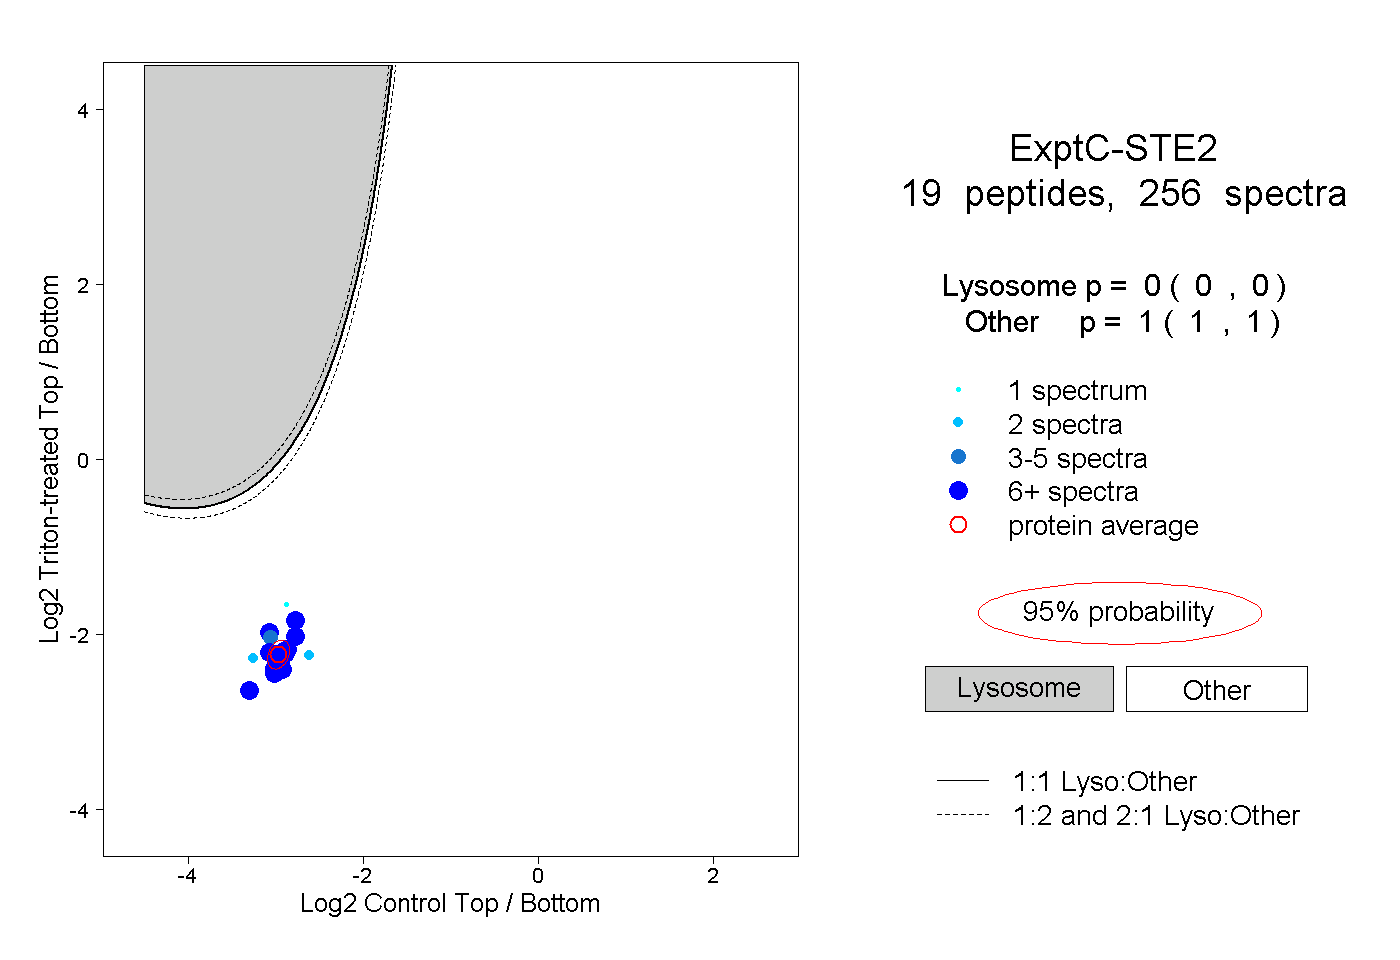
| Expt C |
19
peptides |
256
spectra |
 |
|
0.000
0.000 | 0.000 |
|
|
|
|
|
|
|
1.000
1.000 | 1.000 |
| | | Plot |
|
Lyso |
|
|
|
|
|
|
|
Other |
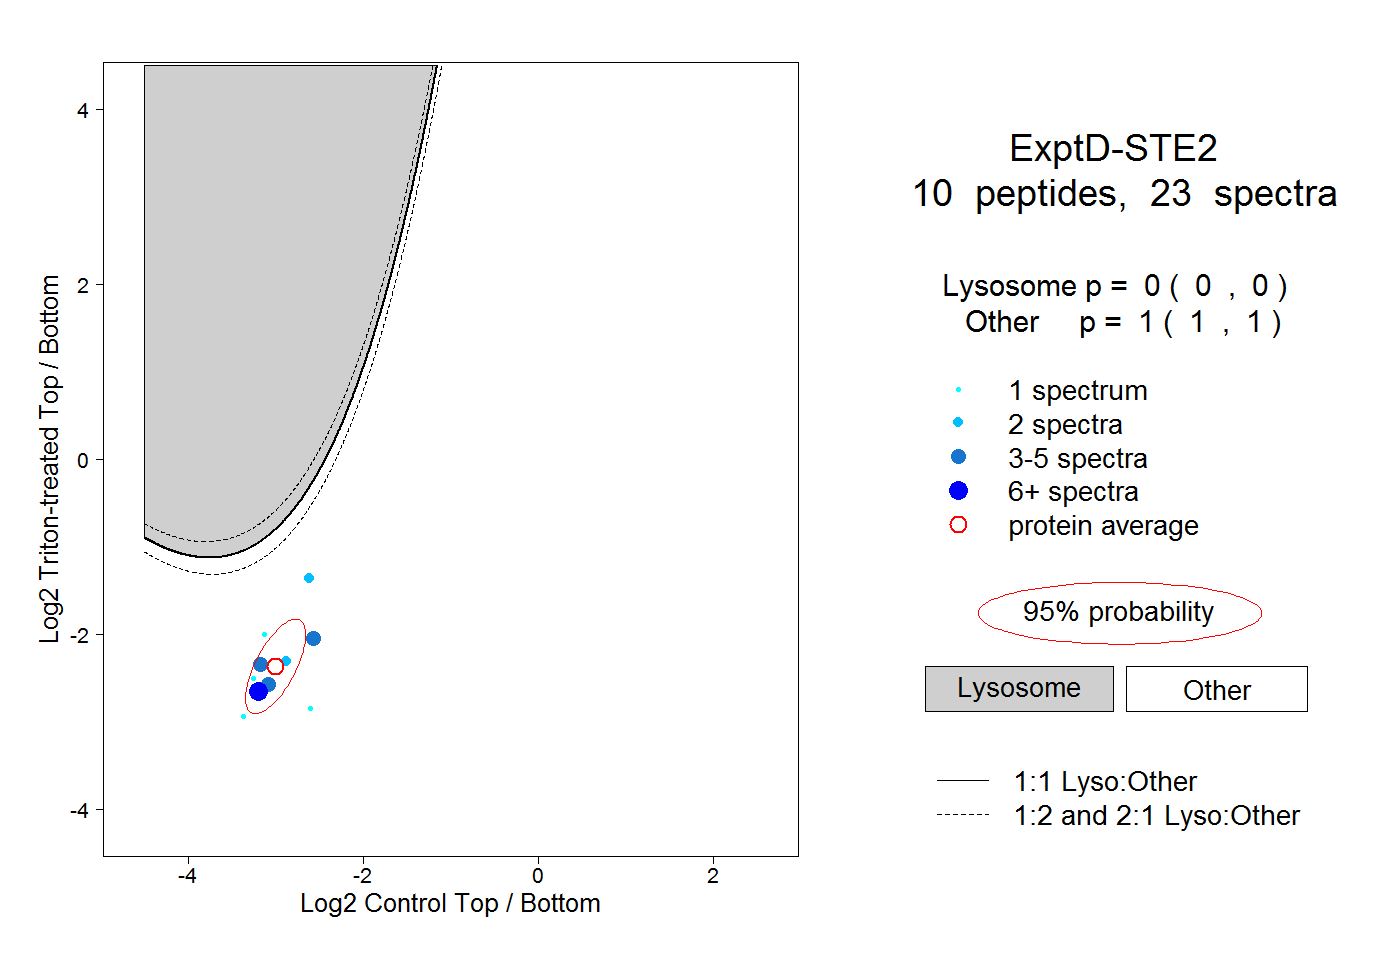
| Expt D |
10
peptides |
23
spectra |
 |
|
0.000
0.000 | 0.000 |
|
|
|
|
|
|
|
1.000
1.000 | 1.000 |
| 1 spectrum, VSPFMR |
|
0.001 |
|
|
|
|
|
|
|
0.999 |
| 1 spectrum, IIYLCR |
|
0.000 |
|
|
|
|
|
|
|
1.000 |
| 3 spectra, GIVGDWR |
|
0.000 |
|
|
|
|
|
|
|
1.000 |
| 3 spectra, GIVGDWK |
|
0.000 |
|
|
|
|
|
|
|
1.000 |
| 1 spectrum, FEEHYQR |
|
0.000 |
|
|
|
|
|
|
|
1.000 |
| 2 spectra, LIEFLER |
|
0.000 |
|
|
|
|
|
|
|
1.000 |
| 1 spectrum, SYPNPK |
|
0.000 |
|
|
|
|
|
|
|
1.000 |
| 6 spectra, SFSEFVEK |
|
0.000 |
|
|
|
|
|
|
|
1.000 |
| 3 spectra, EGDVEK |
|
0.000 |
|
|
|
|
|
|
|
1.000 |
| 2 spectra, LLPASFWEK |
|
0.002 |
|
|
|
|
|
|
|
0.998 |