 21
21peptides
spectra
0.000 | 0.000
0.000 | 0.000
0.000 | 0.000
0.000 | 0.000
0.000 | 0.000
0.000 | 0.000
1.000 | 1.000
0.000 | 0.000
| Plot | Mito | Lyso | Perox | ER | Golgi | PM | Cytosol | Nucleus | |||||
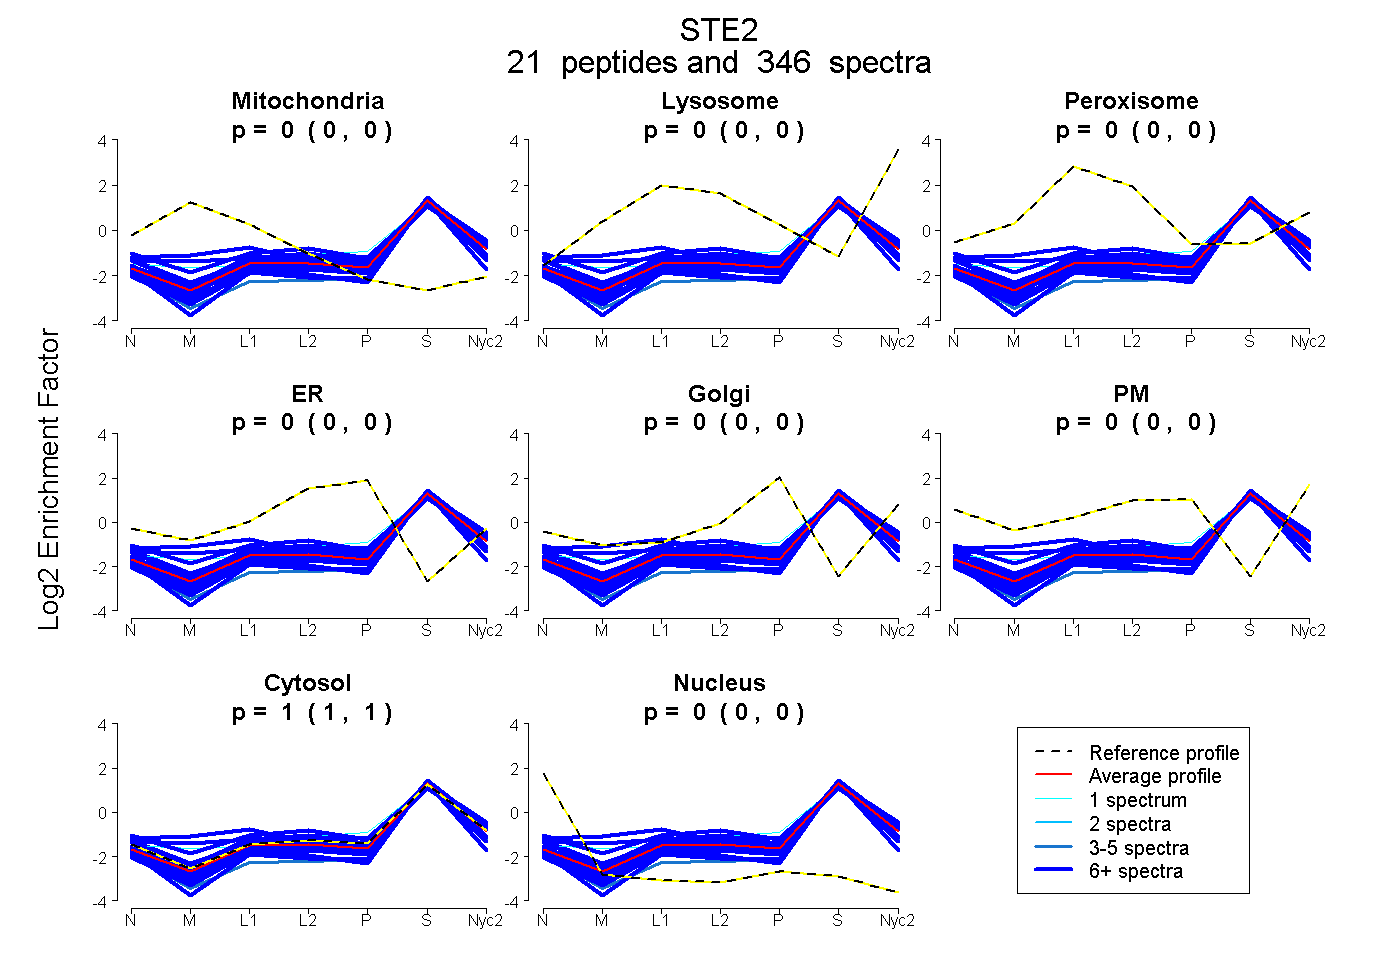
| Expt A |
21 peptides |
346 spectra |
|
0.000 0.000 | 0.000 |
0.000 0.000 | 0.000 |
0.000 0.000 | 0.000 |
0.000 0.000 | 0.000 |
0.000 0.000 | 0.000 |
0.000 0.000 | 0.000 |
1.000 1.000 | 1.000 |
0.000 0.000 | 0.000 |
| 10 spectra, VLFMFYEDMK | 0.000 | 0.000 | 0.000 | 0.000 | 0.000 | 0.000 | 1.000 | 0.000 | ||
| 5 spectra, GIVGDWK | 0.000 | 0.000 | 0.000 | 0.000 | 0.000 | 0.000 | 0.982 | 0.018 | ||
| 6 spectra, NNPCTNYSMLPETMIDLK | 0.155 | 0.055 | 0.027 | 0.000 | 0.000 | 0.000 | 0.763 | 0.000 | ||
| 30 spectra, LIEFLER | 0.000 | 0.000 | 0.000 | 0.000 | 0.000 | 0.000 | 1.000 | 0.000 | ||
| 5 spectra, DPLAELVDK | 0.000 | 0.000 | 0.000 | 0.000 | 0.000 | 0.000 | 0.933 | 0.067 | ||
| 18 spectra, SYPNPK | 0.000 | 0.000 | 0.000 | 0.000 | 0.000 | 0.000 | 0.950 | 0.050 | ||
| 24 spectra, SFSEFVEK | 0.000 | 0.034 | 0.000 | 0.000 | 0.000 | 0.000 | 0.966 | 0.000 | ||
| 17 spectra, NEDLINGIK | 0.111 | 0.065 | 0.000 | 0.000 | 0.000 | 0.000 | 0.824 | 0.000 | ||
| 16 spectra, LLPASFWEK | 0.000 | 0.000 | 0.000 | 0.000 | 0.000 | 0.000 | 0.977 | 0.023 | ||
| 12 spectra, EGDVEK | 0.000 | 0.000 | 0.000 | 0.000 | 0.000 | 0.000 | 0.981 | 0.019 | ||
| 27 spectra, VSPFMR | 0.000 | 0.000 | 0.000 | 0.000 | 0.000 | 0.000 | 1.000 | 0.000 | ||
| 20 spectra, IIYLCR | 0.000 | 0.000 | 0.000 | 0.000 | 0.000 | 0.000 | 0.935 | 0.065 | ||
| 1 spectrum, GIVGDWR | 0.030 | 0.037 | 0.000 | 0.000 | 0.054 | 0.000 | 0.880 | 0.000 | ||
| 20 spectra, FEEHYQR | 0.000 | 0.002 | 0.011 | 0.011 | 0.000 | 0.034 | 0.942 | 0.000 | ||
| 47 spectra, THLPAK | 0.000 | 0.004 | 0.010 | 0.000 | 0.000 | 0.000 | 0.986 | 0.000 | ||
| 12 spectra, FMEGQVPYGSWYDHVK | 0.000 | 0.052 | 0.000 | 0.000 | 0.000 | 0.000 | 0.948 | 0.000 | ||
| 11 spectra, NHFPEALR | 0.042 | 0.000 | 0.107 | 0.000 | 0.000 | 0.014 | 0.837 | 0.000 | ||
| 8 spectra, SGSTWIGEIVDMIYK | 0.000 | 0.007 | 0.000 | 0.000 | 0.000 | 0.000 | 0.993 | 0.000 | ||
| 12 spectra, IIQHTSFQEMK | 0.004 | 0.012 | 0.000 | 0.000 | 0.000 | 0.000 | 0.980 | 0.003 | ||
| 21 spectra, EDAIFNR | 0.000 | 0.000 | 0.000 | 0.000 | 0.000 | 0.000 | 1.000 | 0.000 | ||
| 24 spectra, IPYLECR | 0.000 | 0.000 | 0.000 | 0.000 | 0.000 | 0.000 | 0.987 | 0.013 |
| Plot | Mito | Lyso or Perox | ER | Golgi | PM | Cytosol | Nucleus | ||||||
| Expt B |
14 peptides |
63 spectra |
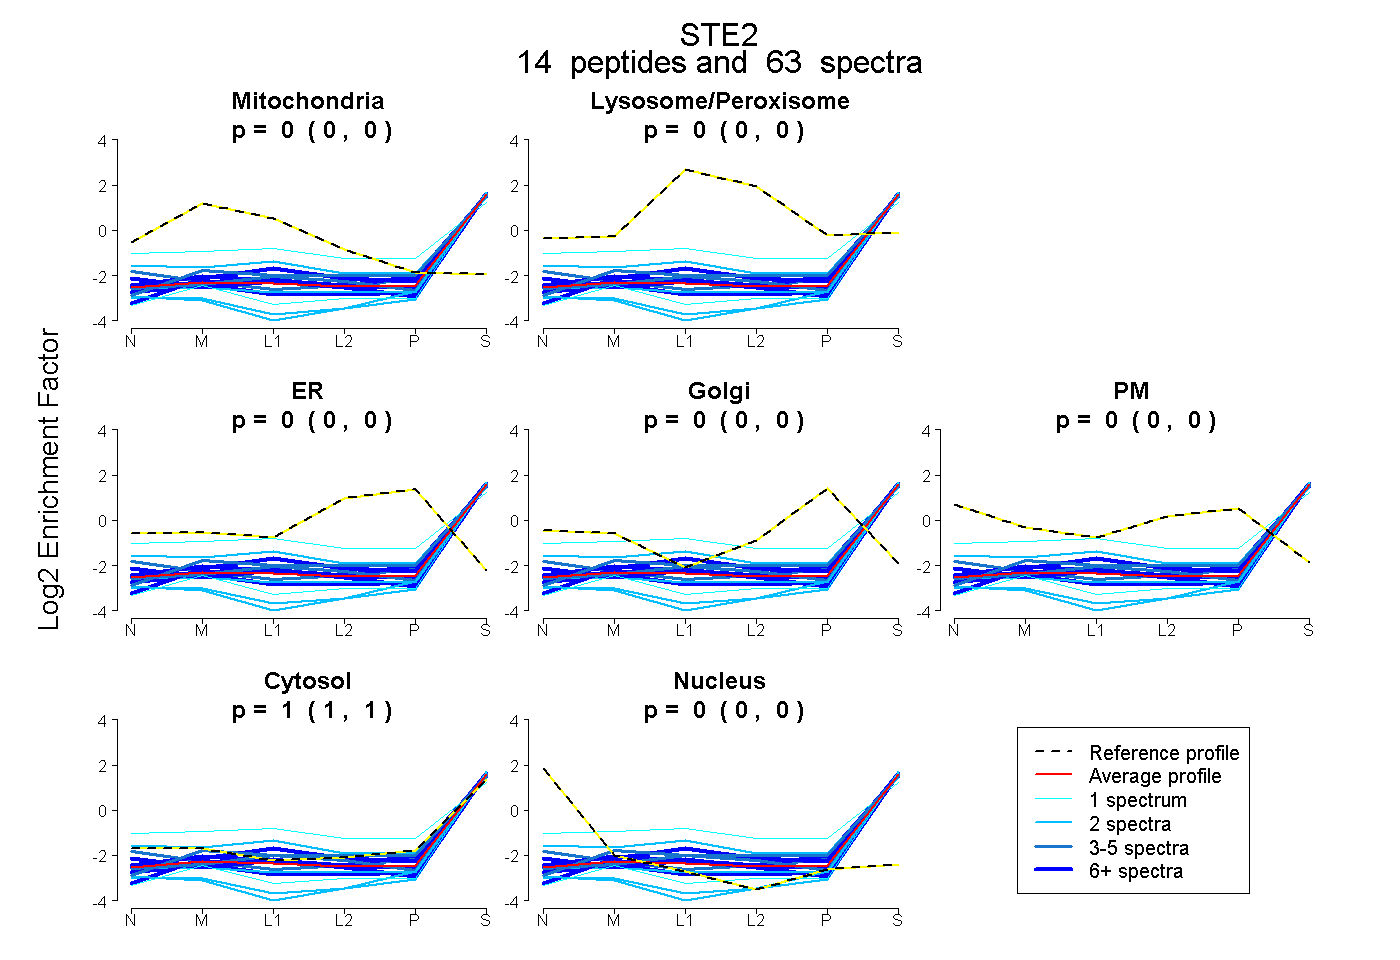 |
0.000 0.000 | 0.000 |
0.000 0.000 | 0.000 |
0.000 0.000 | 0.000 |
0.000 0.000 | 0.000 |
0.000 0.000 | 0.000 |
1.000 1.000 | 1.000 |
0.000 0.000 | 0.000 |
|||
| Plot | Lyso | Other | |||||||||||
| Expt C |
19 peptides |
256 spectra |
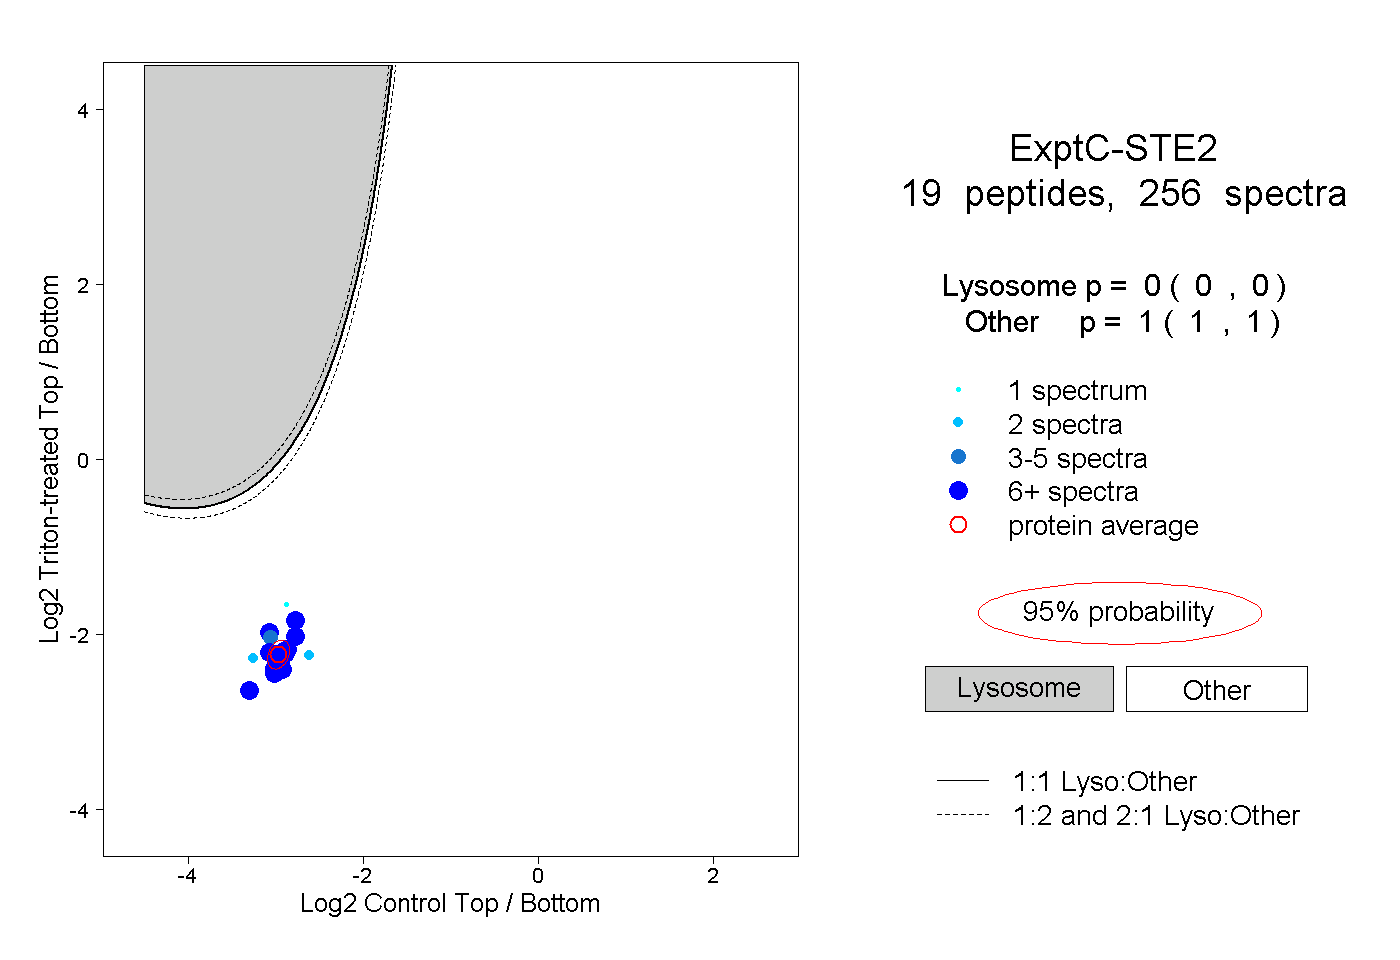 |
0.000 0.000 | 0.000 |
1.000 1.000 | 1.000 |
||||||||
| Plot | Lyso | Other | |||||||||||
| Expt D |
10 peptides |
23 spectra |
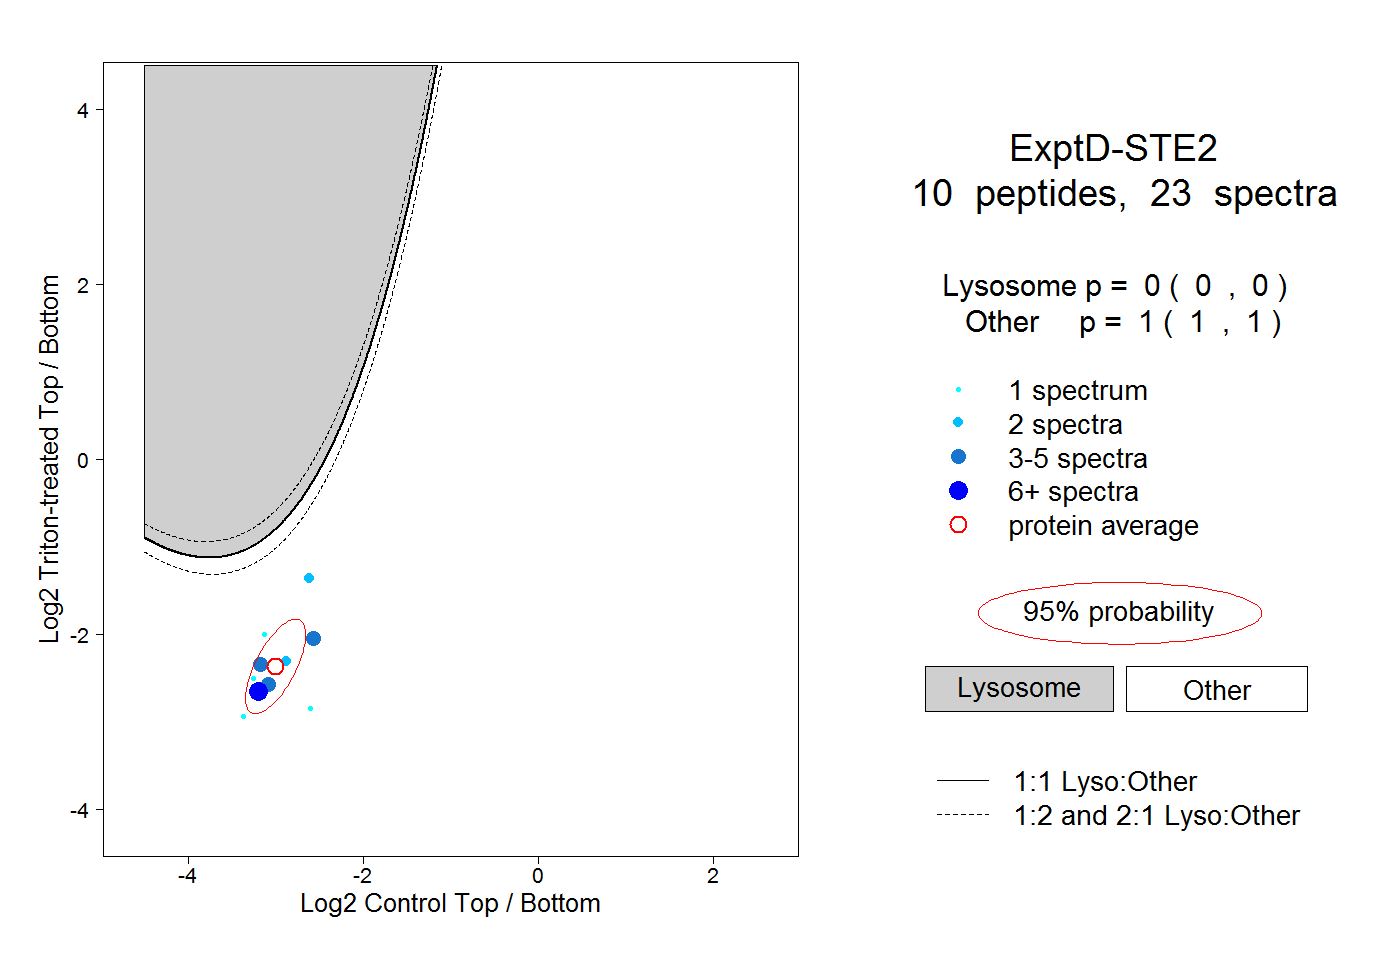 |
0.000 0.000 | 0.000 |
1.000 1.000 | 1.000 |