 2
2peptides
spectra
0.000 | 0.070
0.000 | 0.000
0.051 | 0.184
0.472 | 0.786
0.000 | 0.167
0.000 | 0.119
0.048 | 0.121
0.000 | 0.000
3peptides
spectra
0.000 | 0.000
1.000 | 1.000
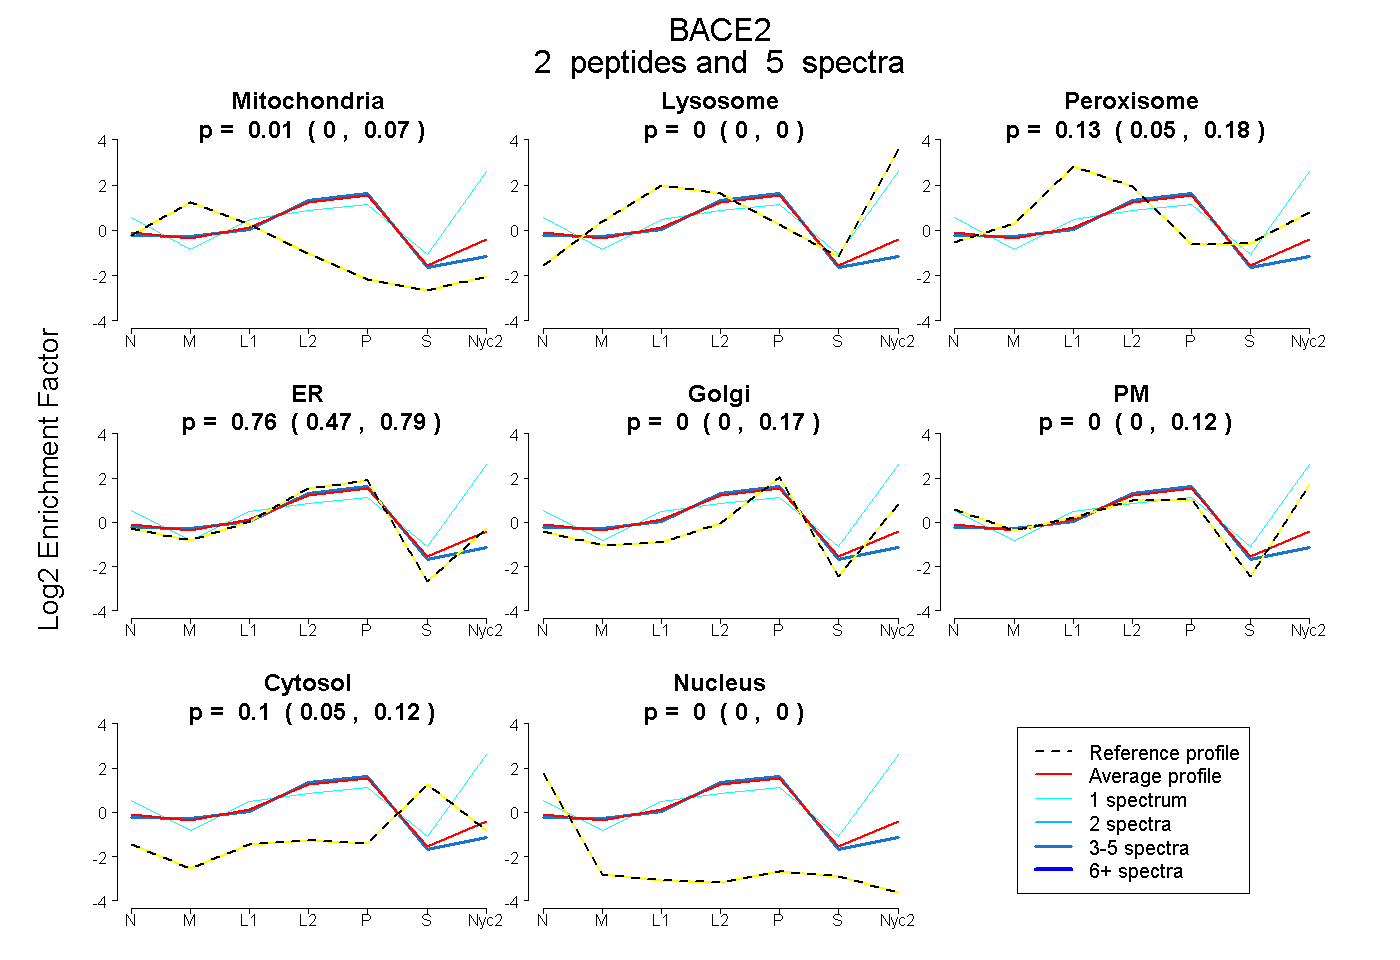
| Plot | Mito | Lyso | Perox | ER | Golgi | PM | Cytosol | Nucleus | |||||
| Expt A |
2 peptides |
5 spectra |
|
0.013 0.000 | 0.070 |
0.000 0.000 | 0.000 |
0.126 0.051 | 0.184 |
0.760 0.472 | 0.786 |
0.002 0.000 | 0.167 |
0.000 0.000 | 0.119 |
0.099 0.048 | 0.121 |
0.000 0.000 | 0.000 |
||
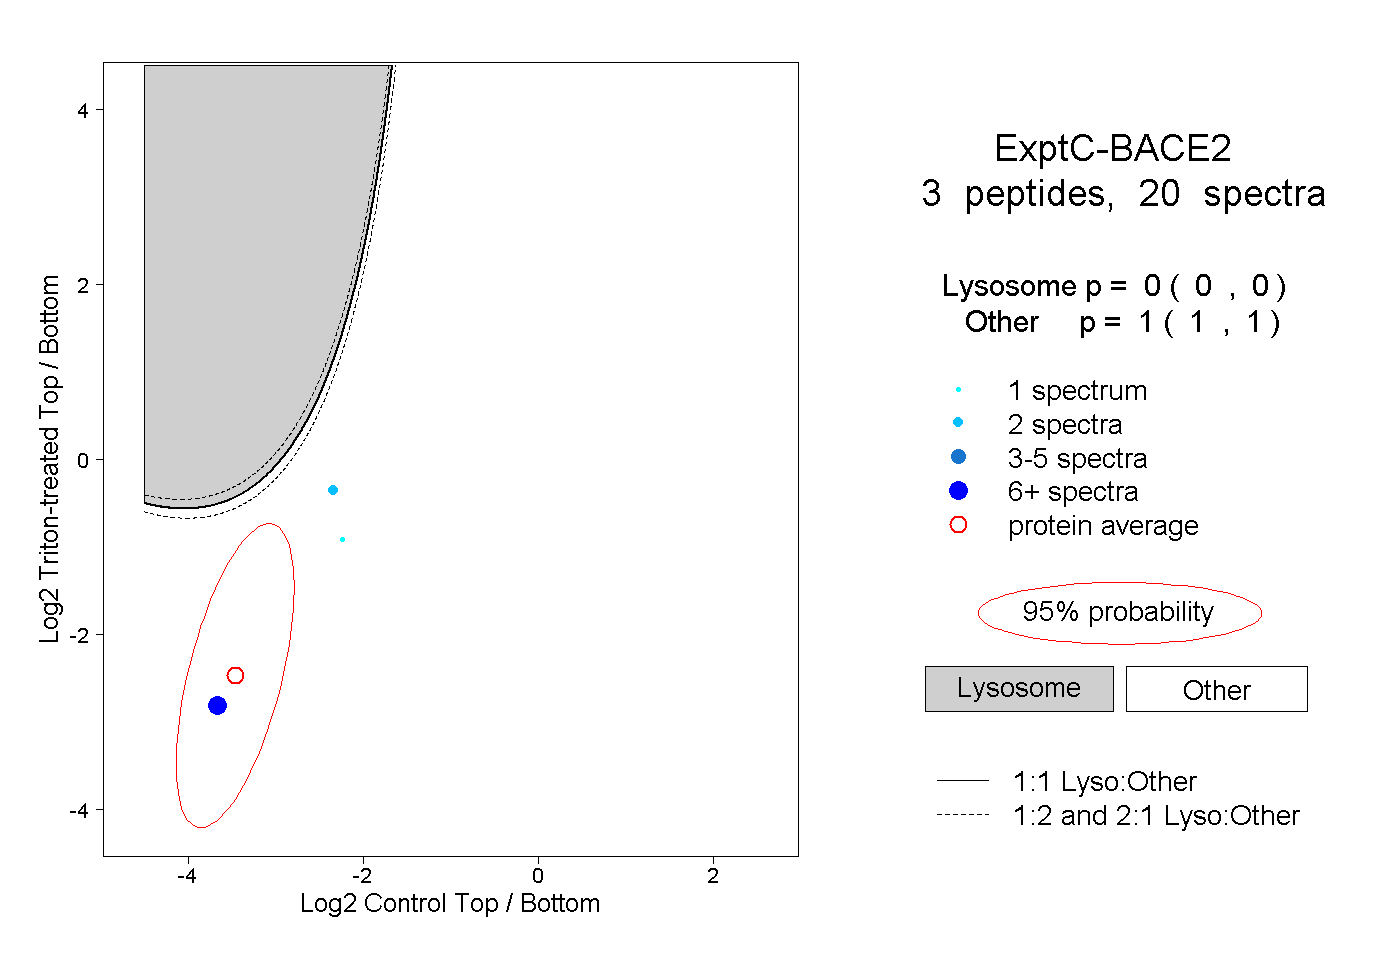
| Plot | Lyso | Other | |||||||||||
| Expt C |
3 peptides |
20 spectra |
|
0.000 0.000 | 0.000 |
1.000 1.000 | 1.000 |