 2
2peptides
spectra

0.000 | 0.000
0.000 | 0.000
0.000 | 0.000
0.115 | 0.210
0.296 | 0.405
0.129 | 0.247
0.189 | 0.248
0.047 | 0.078
4peptides
spectra
0.000 | 0.000
1.000 | 1.000
| Plot | Mito | Lyso | Perox | ER | Golgi | PM | Cytosol | Nucleus | |||||
| Expt A |
2 peptides |
4 spectra |
|
0.000 0.000 | 0.000 |
0.000 0.000 | 0.000 |
0.000 0.000 | 0.000 |
0.169 0.115 | 0.210 |
0.354 0.296 | 0.405 |
0.193 0.129 | 0.247 |
0.220 0.189 | 0.248 |
0.064 0.047 | 0.078 |
||
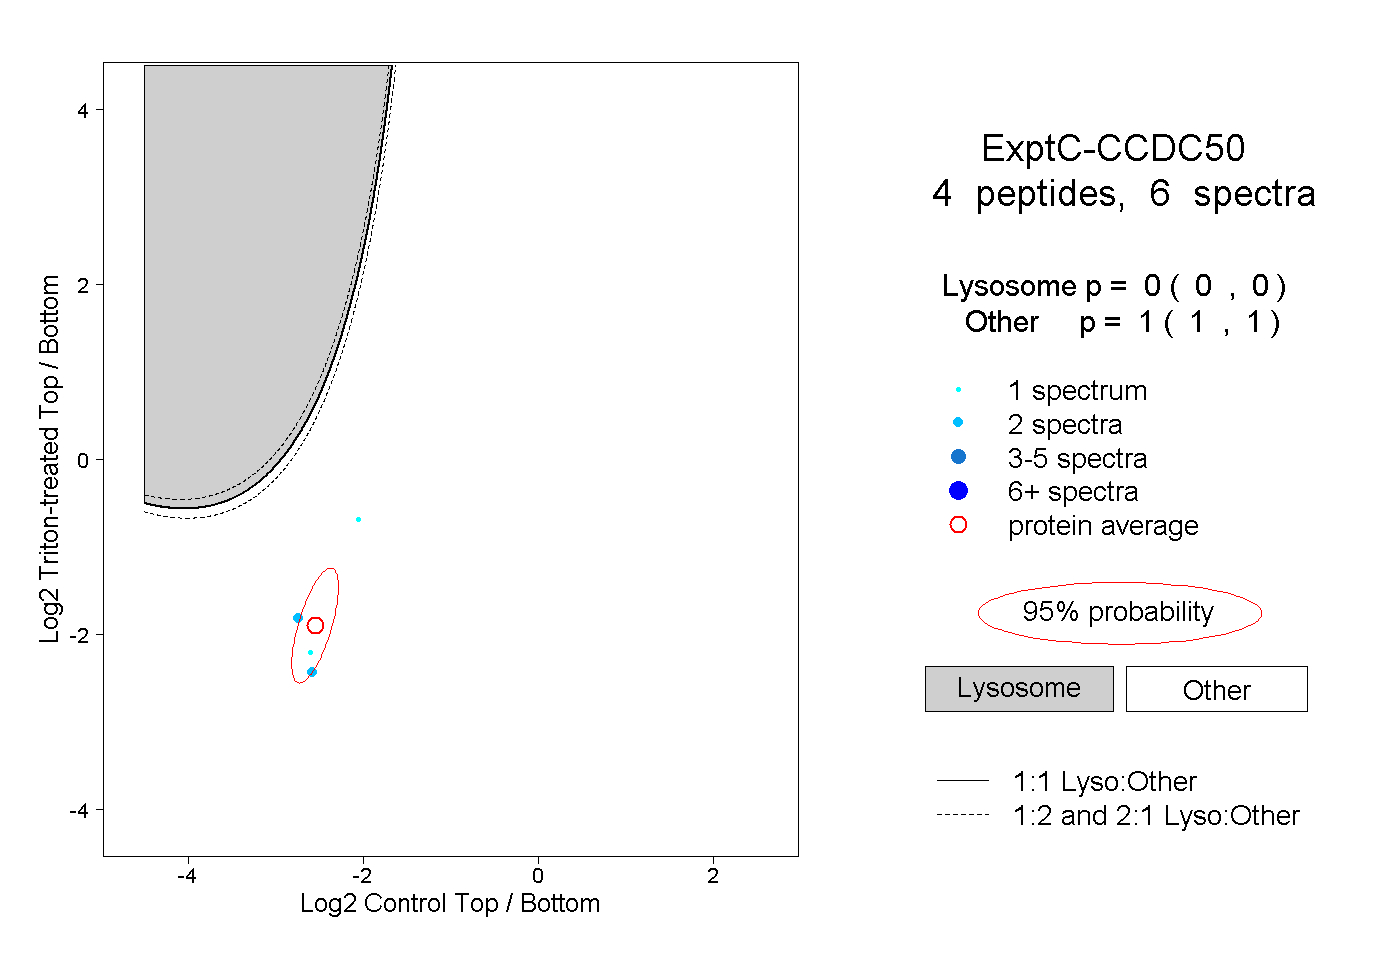
| Plot | Lyso | Other | |||||||||||
| Expt C |
4 peptides |
6 spectra |
|
0.000 0.000 | 0.000 |
1.000 1.000 | 1.000 |