13
13peptides
spectra
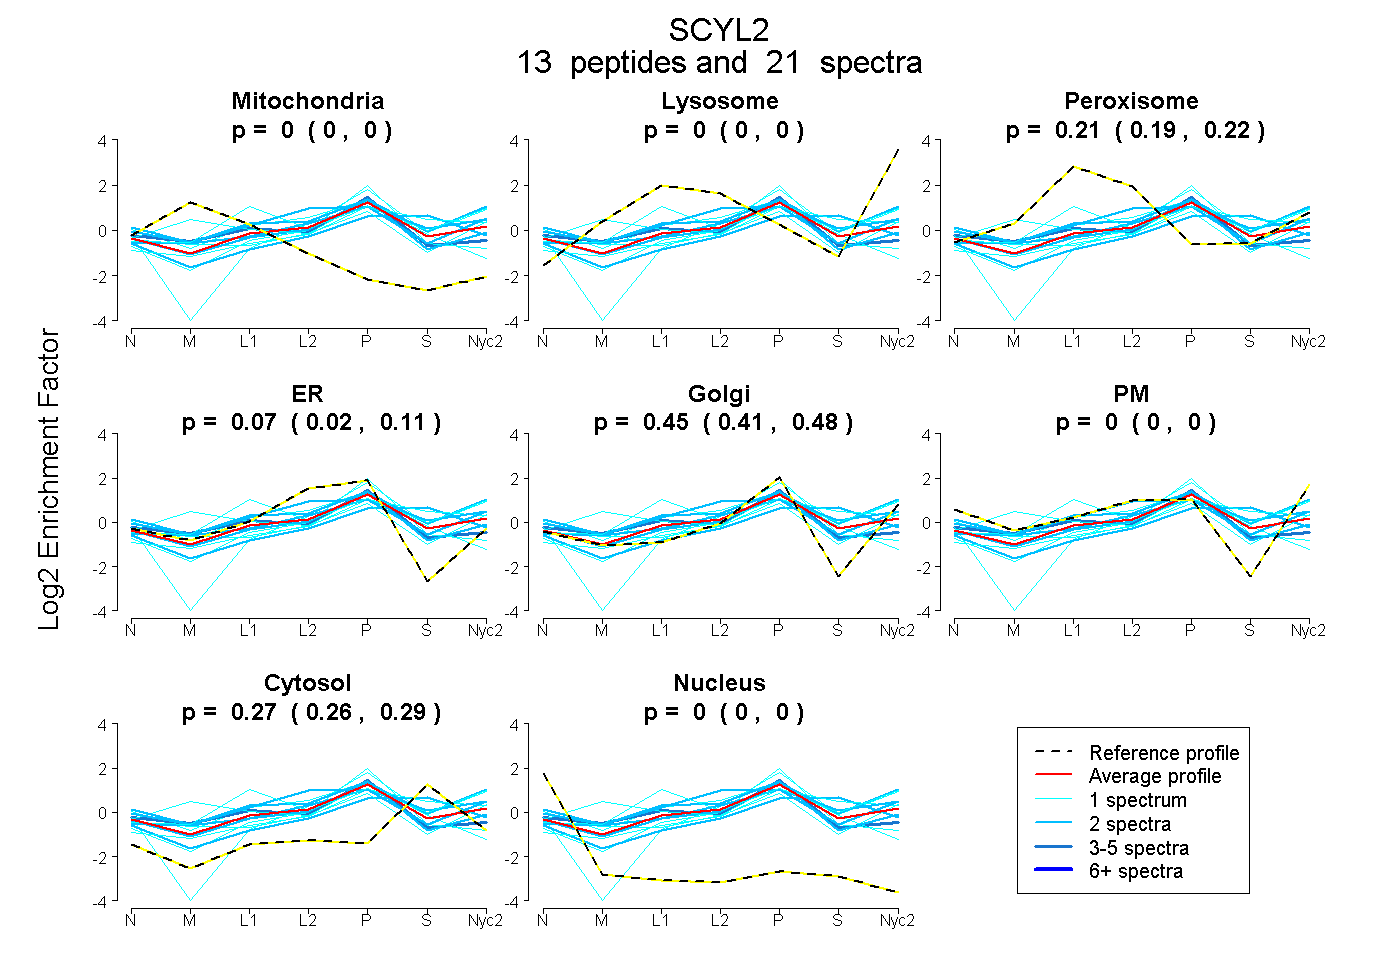
0.000 | 0.000
0.000 | 0.000
0.186 | 0.223
0.023 | 0.106
0.408 | 0.485
0.000 | 0.000
0.259 | 0.288
0.000 | 0.000
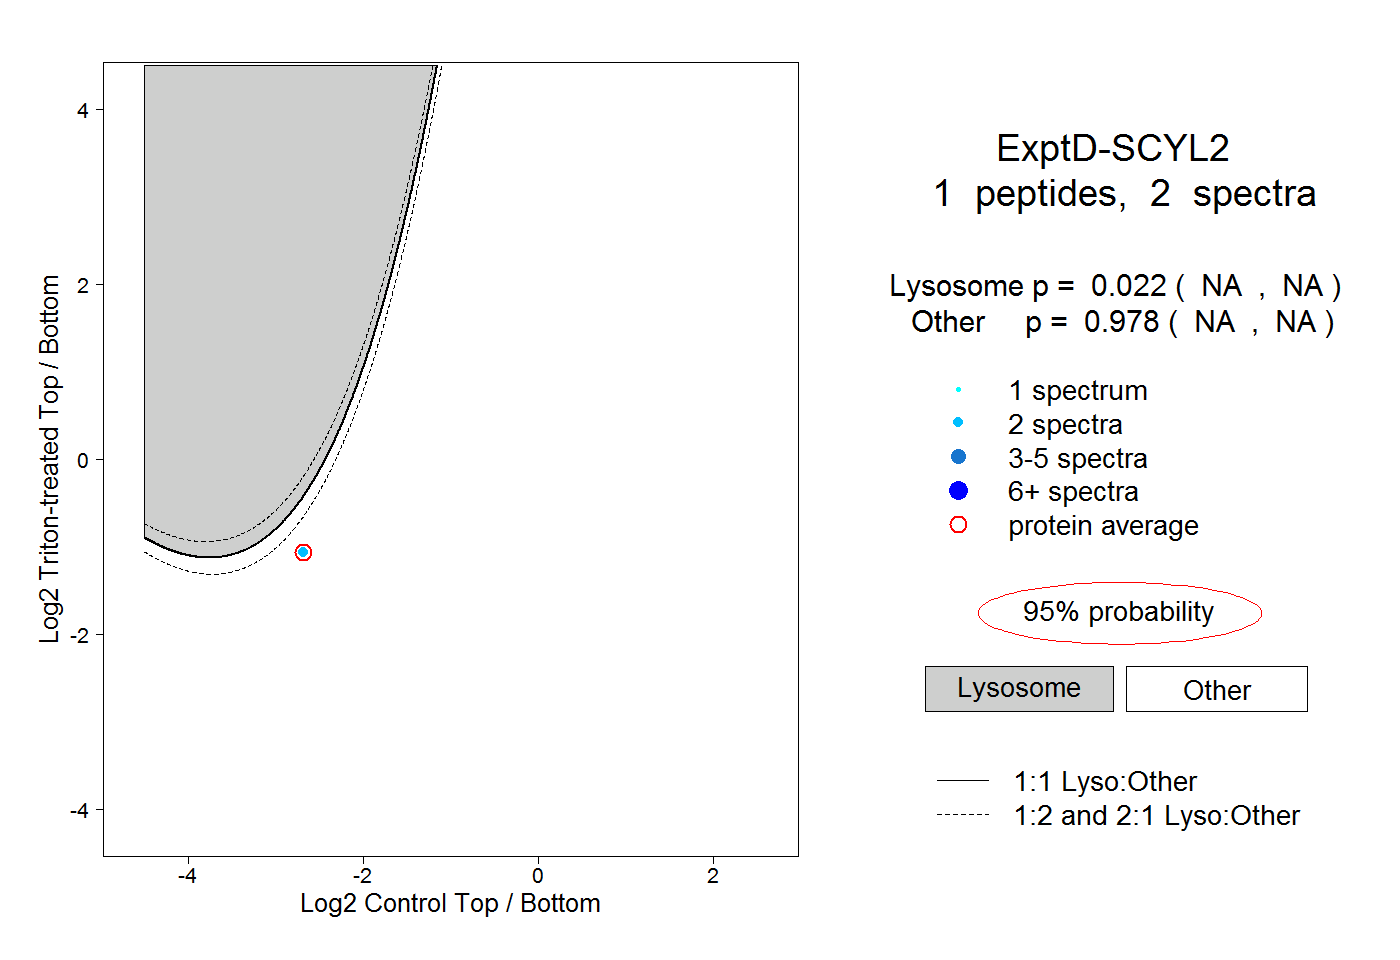
1peptide
spectra
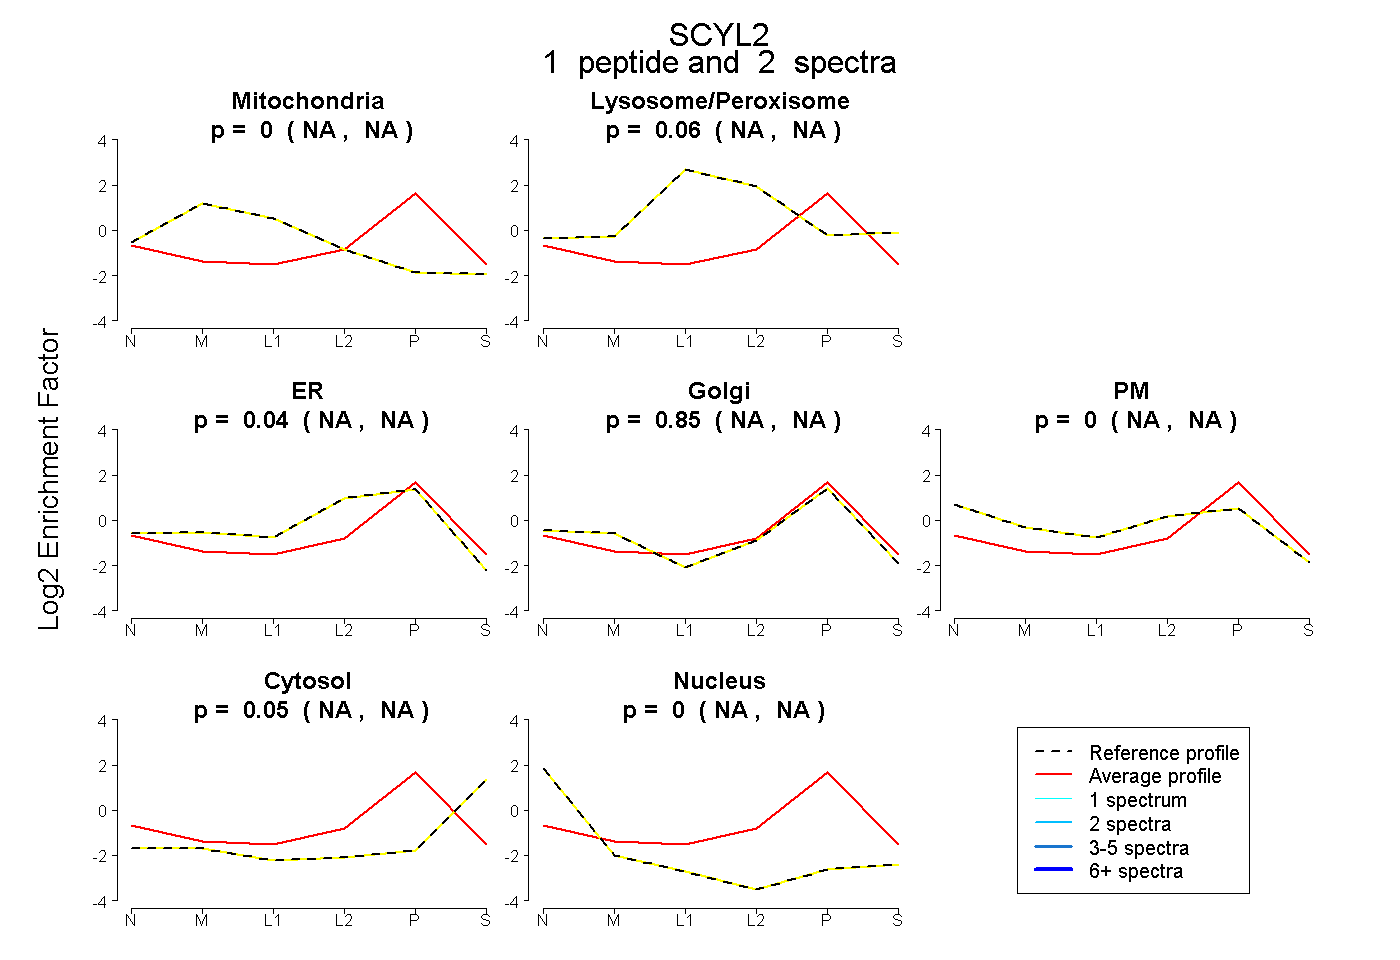
NA | NA
NA | NA
NA | NA
NA | NA
NA | NA
NA | NA
NA | NA
10peptides
spectra
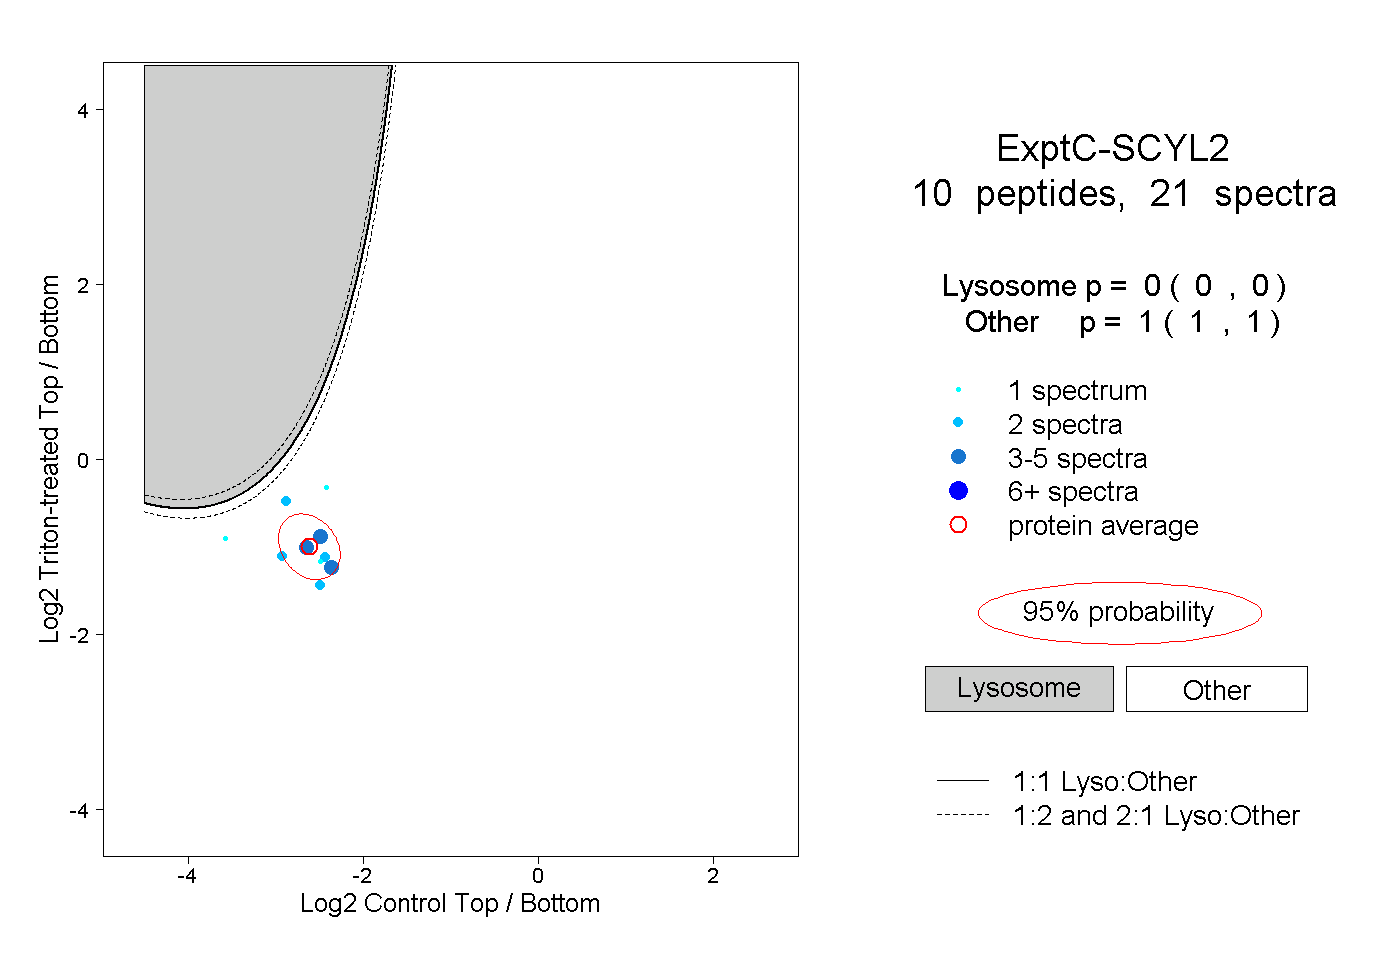
0.000 | 0.000
1.000 | 1.000