 13
13peptides
spectra
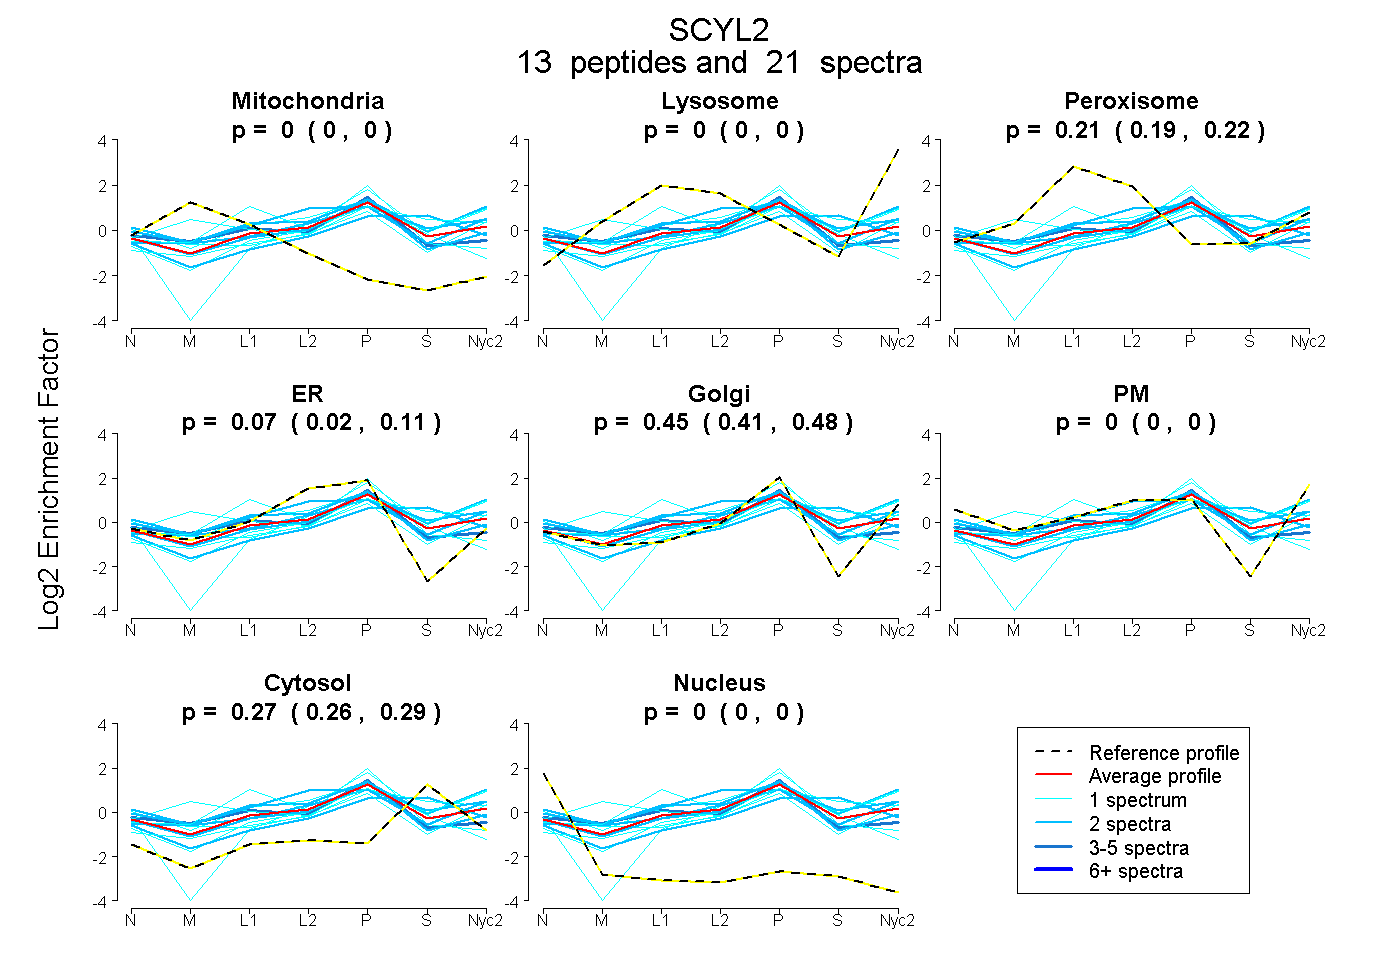
0.000 | 0.000
0.000 | 0.000
0.186 | 0.223
0.023 | 0.106
0.408 | 0.485
0.000 | 0.000
0.259 | 0.288
0.000 | 0.000
| Plot | Mito | Lyso | Perox | ER | Golgi | PM | Cytosol | Nucleus | |||||
| Expt A |
13 peptides |
21 spectra |
|
0.000 0.000 | 0.000 |
0.000 0.000 | 0.000 |
0.206 0.186 | 0.223 |
0.068 0.023 | 0.106 |
0.451 0.408 | 0.485 |
0.000 0.000 | 0.000 |
0.275 0.259 | 0.288 |
0.000 0.000 | 0.000 |
| 2 spectra, VNSLVCLGK | 0.000 | 0.000 | 0.214 | 0.219 | 0.056 | 0.313 | 0.197 | 0.000 | ||
| 1 spectrum, LLLNVTPTVRPDADQMTK | 0.000 | 0.000 | 0.000 | 0.442 | 0.210 | 0.000 | 0.348 | 0.000 | ||
| 2 spectra, QQEPIQILLIFLQK | 0.000 | 0.000 | 0.244 | 0.262 | 0.332 | 0.000 | 0.162 | 0.000 | ||
| 4 spectra, GVQQLTR | 0.043 | 0.000 | 0.151 | 0.250 | 0.333 | 0.000 | 0.222 | 0.000 | ||
| 2 spectra, NALIPR | 0.000 | 0.058 | 0.229 | 0.000 | 0.427 | 0.000 | 0.285 | 0.000 | ||
| 1 spectrum, MVHGNVTPENIILNK | 0.180 | 0.090 | 0.181 | 0.000 | 0.468 | 0.000 | 0.080 | 0.000 | ||
| 1 spectrum, LILPELGPVFK | 0.000 | 0.000 | 0.000 | 0.000 | 0.611 | 0.000 | 0.389 | 0.000 | ||
| 1 spectrum, VTPSGTQQIDK | 0.000 | 0.148 | 0.330 | 0.000 | 0.321 | 0.000 | 0.201 | 0.000 | ||
| 1 spectrum, MDLLLTK | 0.000 | 0.115 | 0.064 | 0.000 | 0.373 | 0.000 | 0.448 | 0.000 | ||
| 2 spectra, LLTVQHPLEESR | 0.000 | 0.190 | 0.035 | 0.000 | 0.448 | 0.034 | 0.294 | 0.000 | ||
| 2 spectra, LYDVETK | 0.000 | 0.000 | 0.078 | 0.103 | 0.254 | 0.000 | 0.565 | 0.000 | ||
| 1 spectrum, EQLAGK | 0.000 | 0.000 | 0.271 | 0.070 | 0.441 | 0.065 | 0.152 | 0.000 | ||
| 1 spectrum, ILEYLDK | 0.043 | 0.000 | 0.000 | 0.512 | 0.030 | 0.000 | 0.415 | 0.000 |
| Plot | Mito | Lyso or Perox | ER | Golgi | PM | Cytosol | Nucleus | ||||||
| Expt B |
1 peptide |
2 spectra |
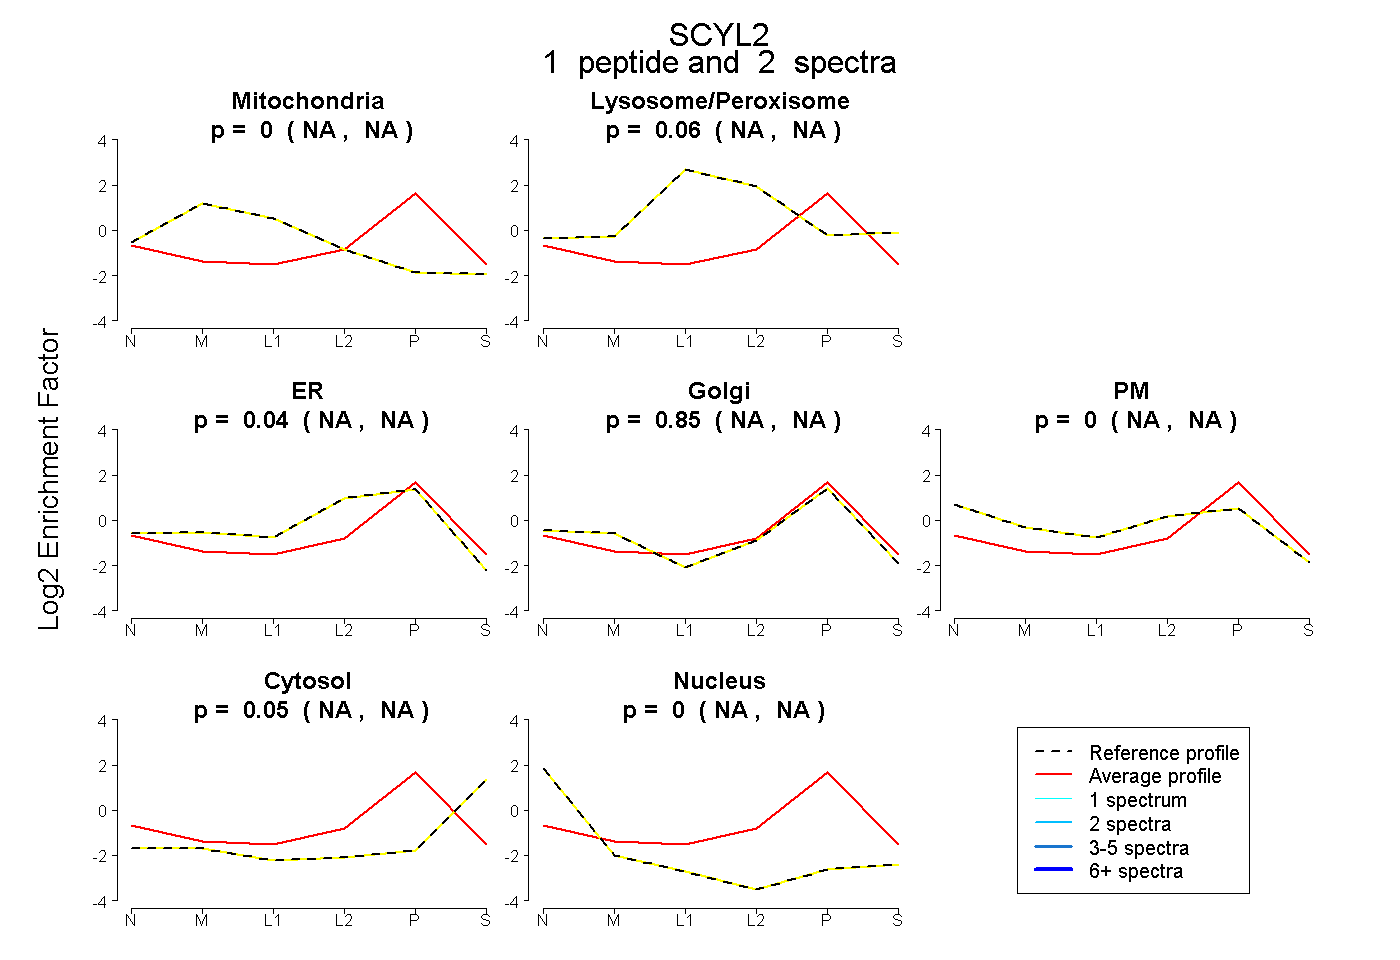 |
0.000 NA | NA |
0.058 NA | NA |
0.042 NA | NA |
0.852 NA | NA |
0.000 NA | NA |
0.048 NA | NA |
0.000 NA | NA |
|||
| Plot | Lyso | Other | |||||||||||
| Expt C |
10 peptides |
21 spectra |
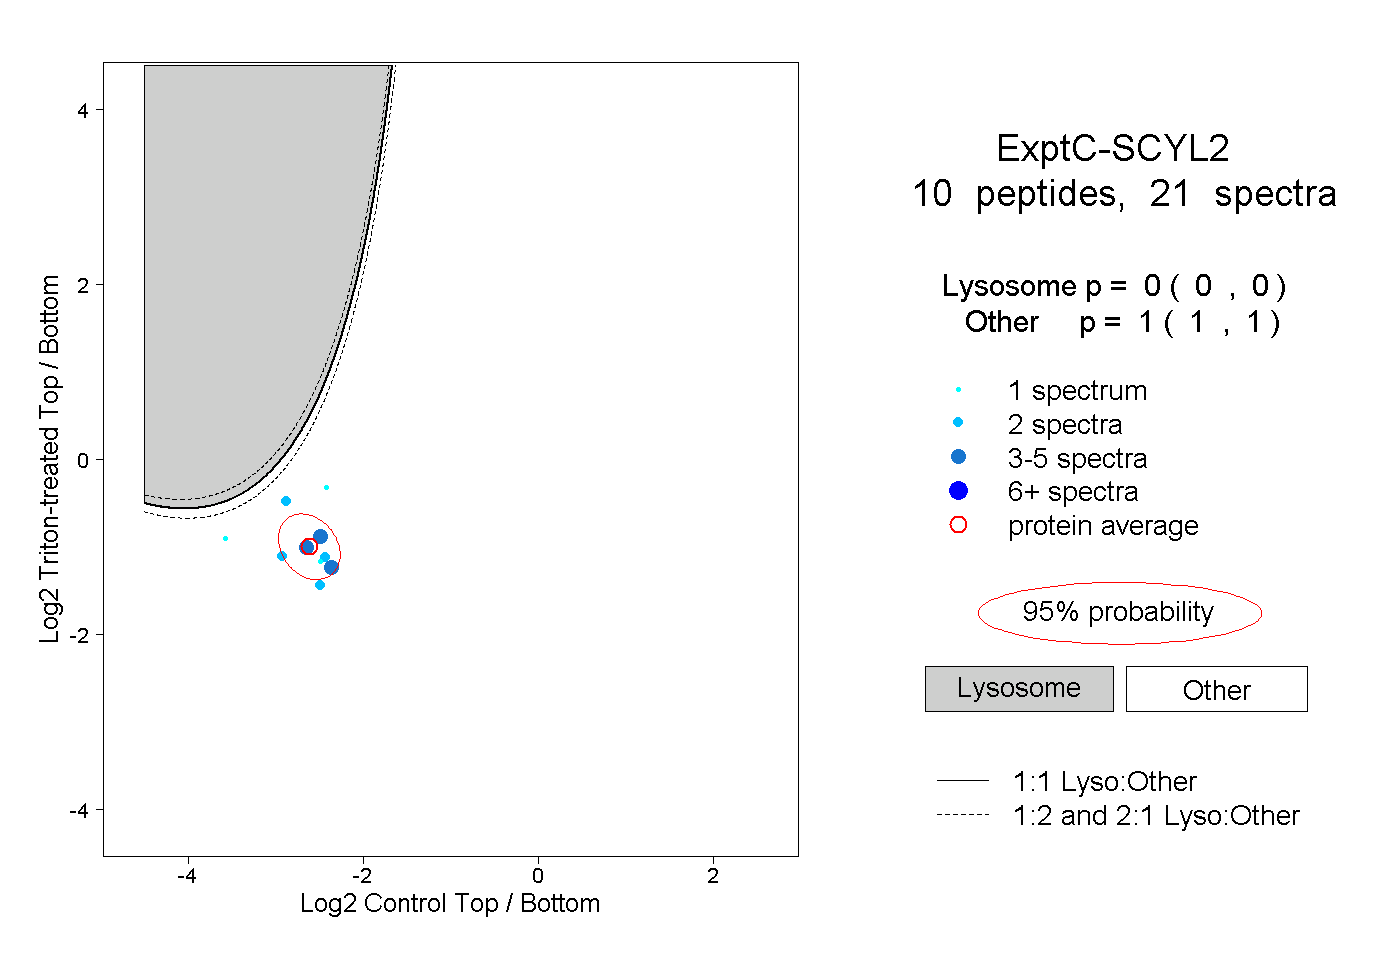 |
0.000 0.000 | 0.000 |
1.000 1.000 | 1.000 |
||||||||
| Plot | Lyso | Other | |||||||||||
| Expt D |
1 peptide |
2 spectra |
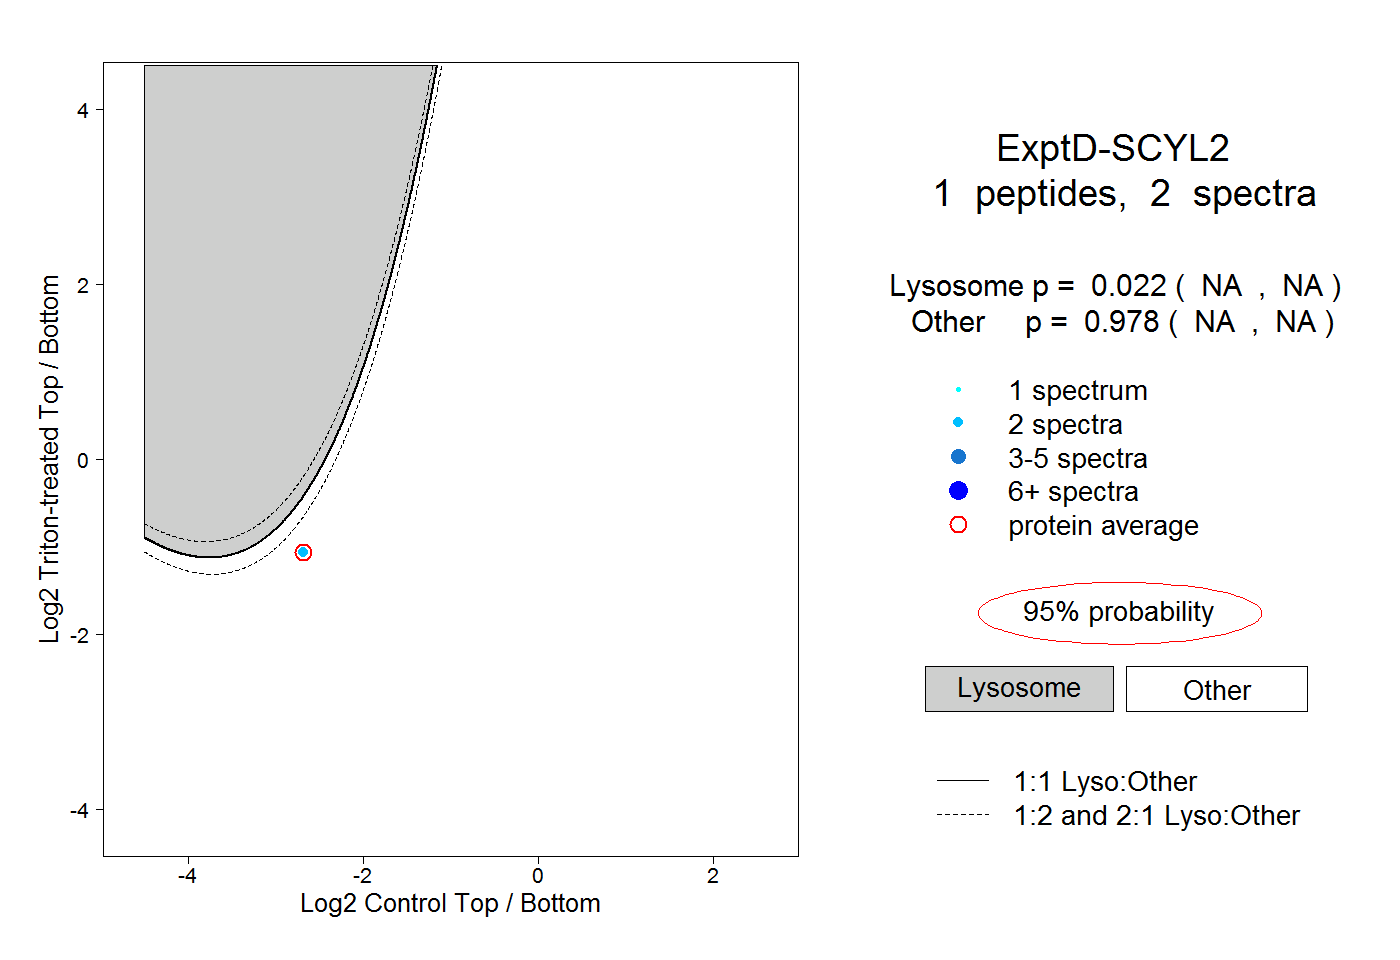 |
0.022 NA | NA |
0.978 NA | NA |