15
15peptides
spectra
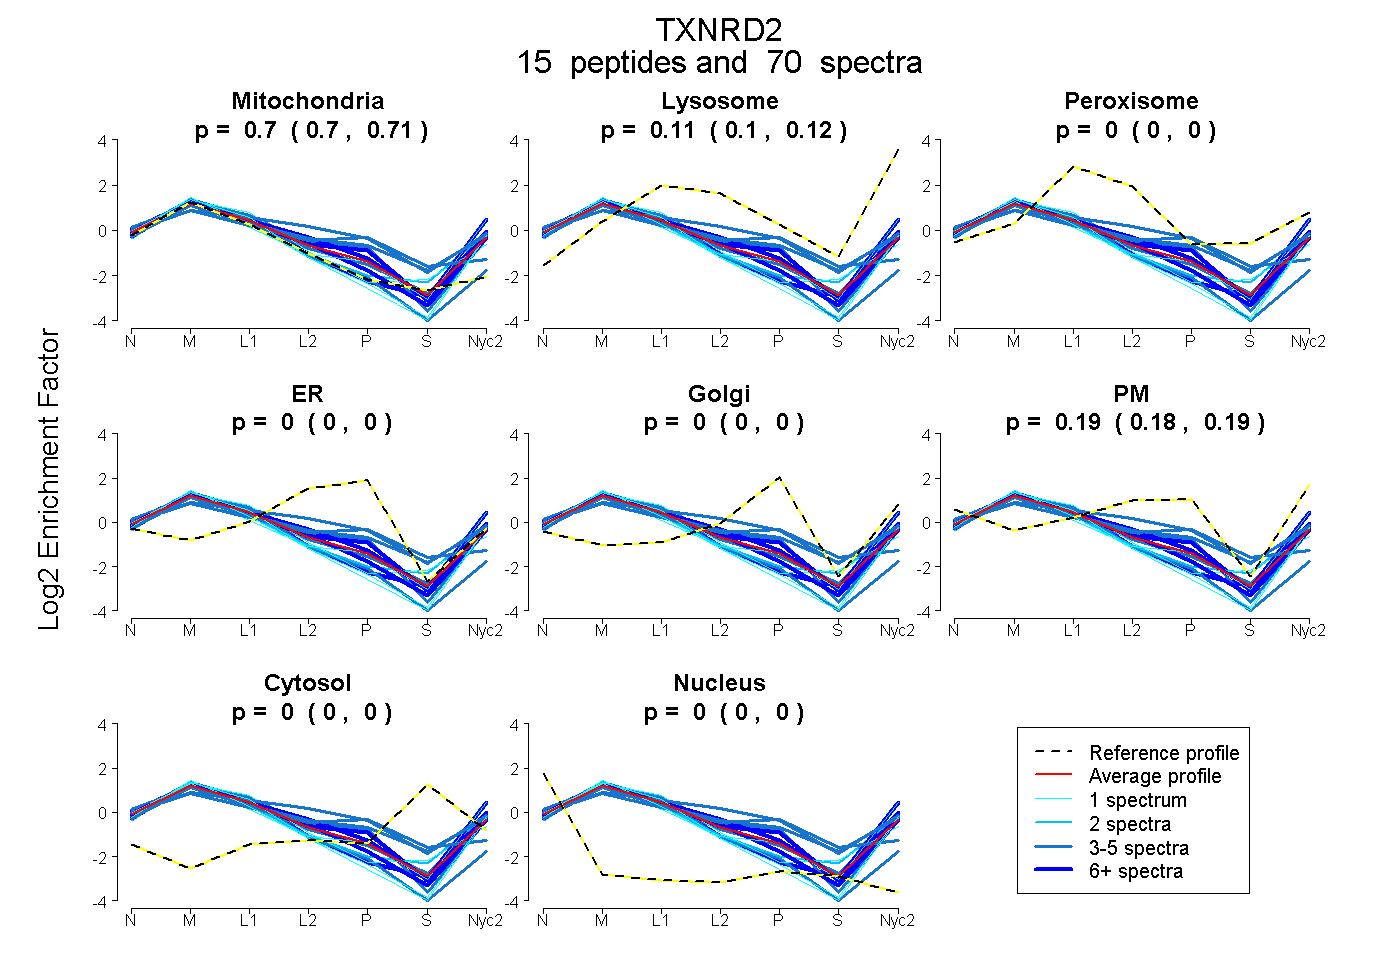
0.697 | 0.708
0.103 | 0.115
0.000 | 0.000
0.000 | 0.000
0.000 | 0.000
0.178 | 0.195
0.000 | 0.000
0.000 | 0.000
7peptides
spectra
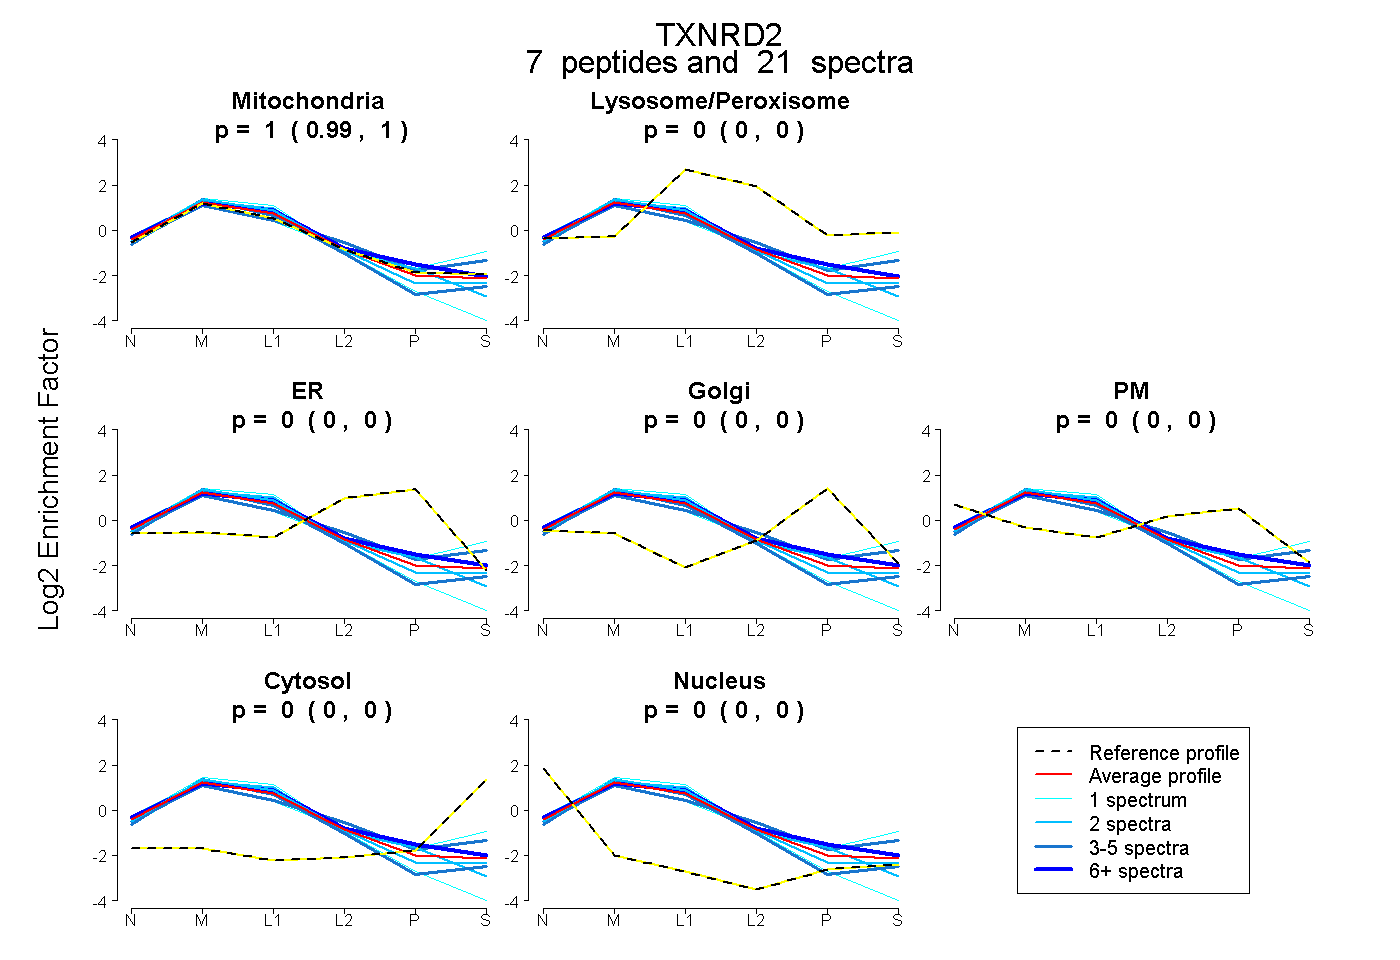
0.995 | 1.000
0.000 | 0.003
0.000 | 0.000
0.000 | 0.000
0.000 | 0.000
0.000 | 0.000
0.000 | 0.000