 15
15peptides
spectra
0.697 | 0.708
0.103 | 0.115
0.000 | 0.000
0.000 | 0.000
0.000 | 0.000
0.178 | 0.195
0.000 | 0.000
0.000 | 0.000
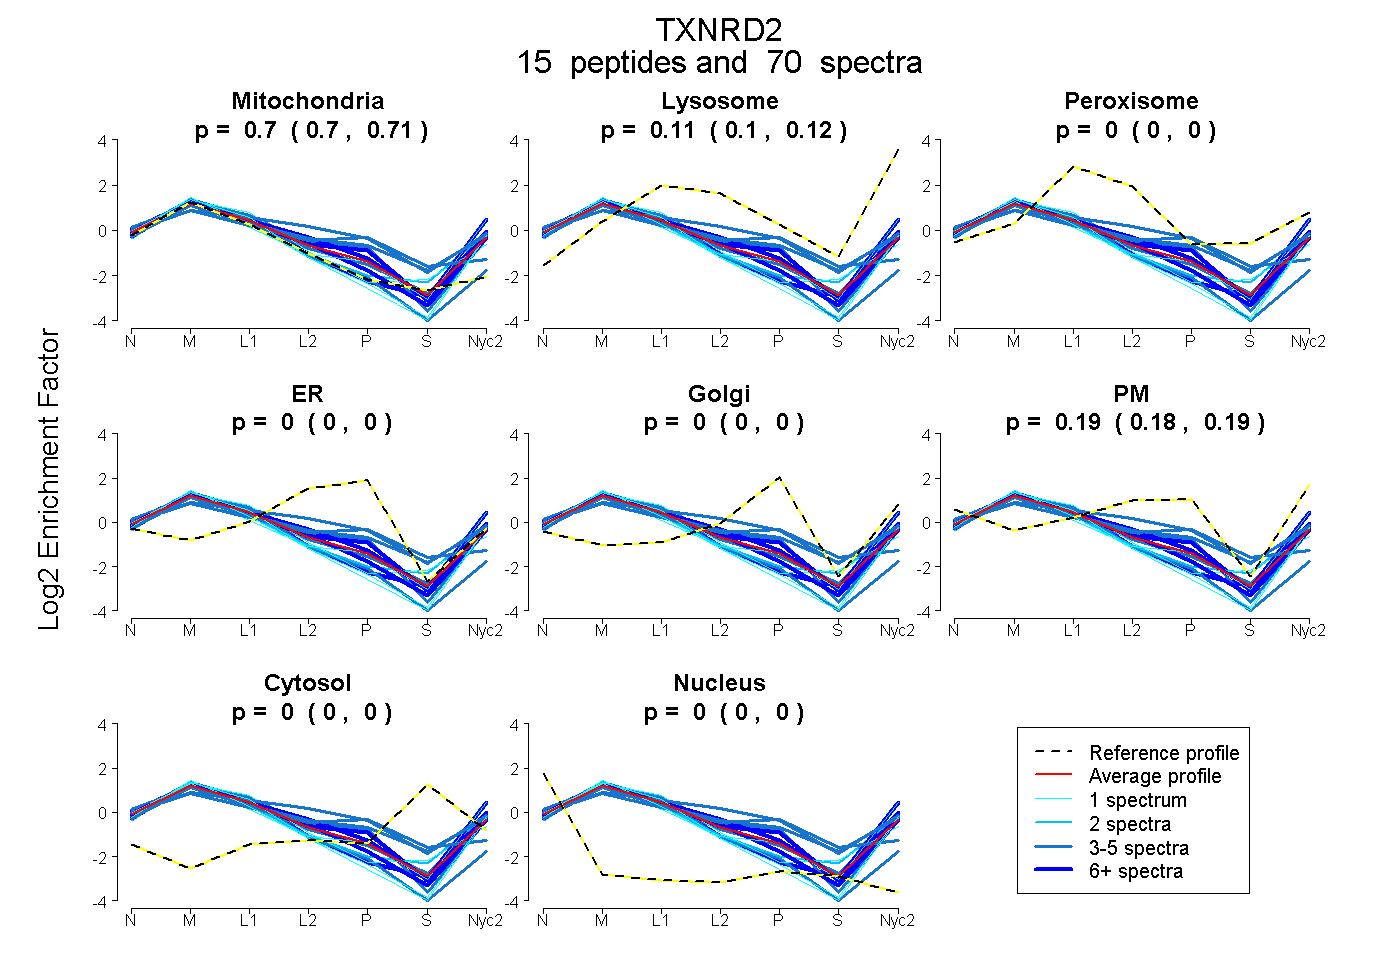
| Plot | Mito | Lyso | Perox | ER | Golgi | PM | Cytosol | Nucleus | |||||
| Expt A |
15 peptides |
70 spectra |
|
0.703 0.697 | 0.708 |
0.110 0.103 | 0.115 |
0.000 0.000 | 0.000 |
0.000 0.000 | 0.000 |
0.000 0.000 | 0.000 |
0.187 0.178 | 0.195 |
0.000 0.000 | 0.000 |
0.000 0.000 | 0.000 |
| 1 spectrum, LPTNQLQVTWEDLASGK | 0.639 | 0.134 | 0.000 | 0.000 | 0.000 | 0.225 | 0.000 | 0.002 | ||
| 14 spectra, HIVIATGGRPK | 0.737 | 0.093 | 0.000 | 0.000 | 0.000 | 0.170 | 0.000 | 0.000 | ||
| 5 spectra, ASFVNEHTVHGVDK | 0.695 | 0.090 | 0.000 | 0.000 | 0.000 | 0.215 | 0.000 | 0.000 | ||
| 3 spectra, SLNWGHR | 0.435 | 0.044 | 0.184 | 0.000 | 0.103 | 0.233 | 0.000 | 0.000 | ||
| 1 spectrum, VTQLSAK | 0.870 | 0.092 | 0.000 | 0.000 | 0.000 | 0.038 | 0.000 | 0.000 | ||
| 1 spectrum, GALEHGITSDDIFWLK | 0.818 | 0.182 | 0.000 | 0.000 | 0.000 | 0.000 | 0.000 | 0.000 | ||
| 4 spectra, AMAEAVQNHVK | 0.638 | 0.037 | 0.000 | 0.000 | 0.000 | 0.325 | 0.000 | 0.000 | ||
| 6 spectra, AGVNTNPK | 0.769 | 0.205 | 0.000 | 0.000 | 0.000 | 0.000 | 0.000 | 0.026 | ||
| 3 spectra, VQLQDR | 0.579 | 0.197 | 0.004 | 0.000 | 0.113 | 0.086 | 0.021 | 0.000 | ||
| 4 spectra, DASQCYIK | 0.980 | 0.000 | 0.000 | 0.000 | 0.000 | 0.020 | 0.000 | 0.000 | ||
| 3 spectra, SGLDPTVTGC | 0.561 | 0.000 | 0.110 | 0.101 | 0.177 | 0.000 | 0.051 | 0.000 | ||
| 1 spectrum, YPTQVK | 0.831 | 0.107 | 0.000 | 0.000 | 0.000 | 0.062 | 0.000 | 0.000 | ||
| 11 spectra, LMHQAALLGGMIR | 0.588 | 0.211 | 0.000 | 0.000 | 0.000 | 0.201 | 0.000 | 0.000 | ||
| 11 spectra, EAAQLGR | 0.610 | 0.076 | 0.000 | 0.000 | 0.000 | 0.314 | 0.000 | 0.000 | ||
| 2 spectra, EDVGTFDTVLWAIGR | 0.738 | 0.234 | 0.000 | 0.000 | 0.000 | 0.000 | 0.000 | 0.028 |
| Plot | Mito | Lyso or Perox | ER | Golgi | PM | Cytosol | Nucleus | ||||||
| Expt B |
7 peptides |
21 spectra |
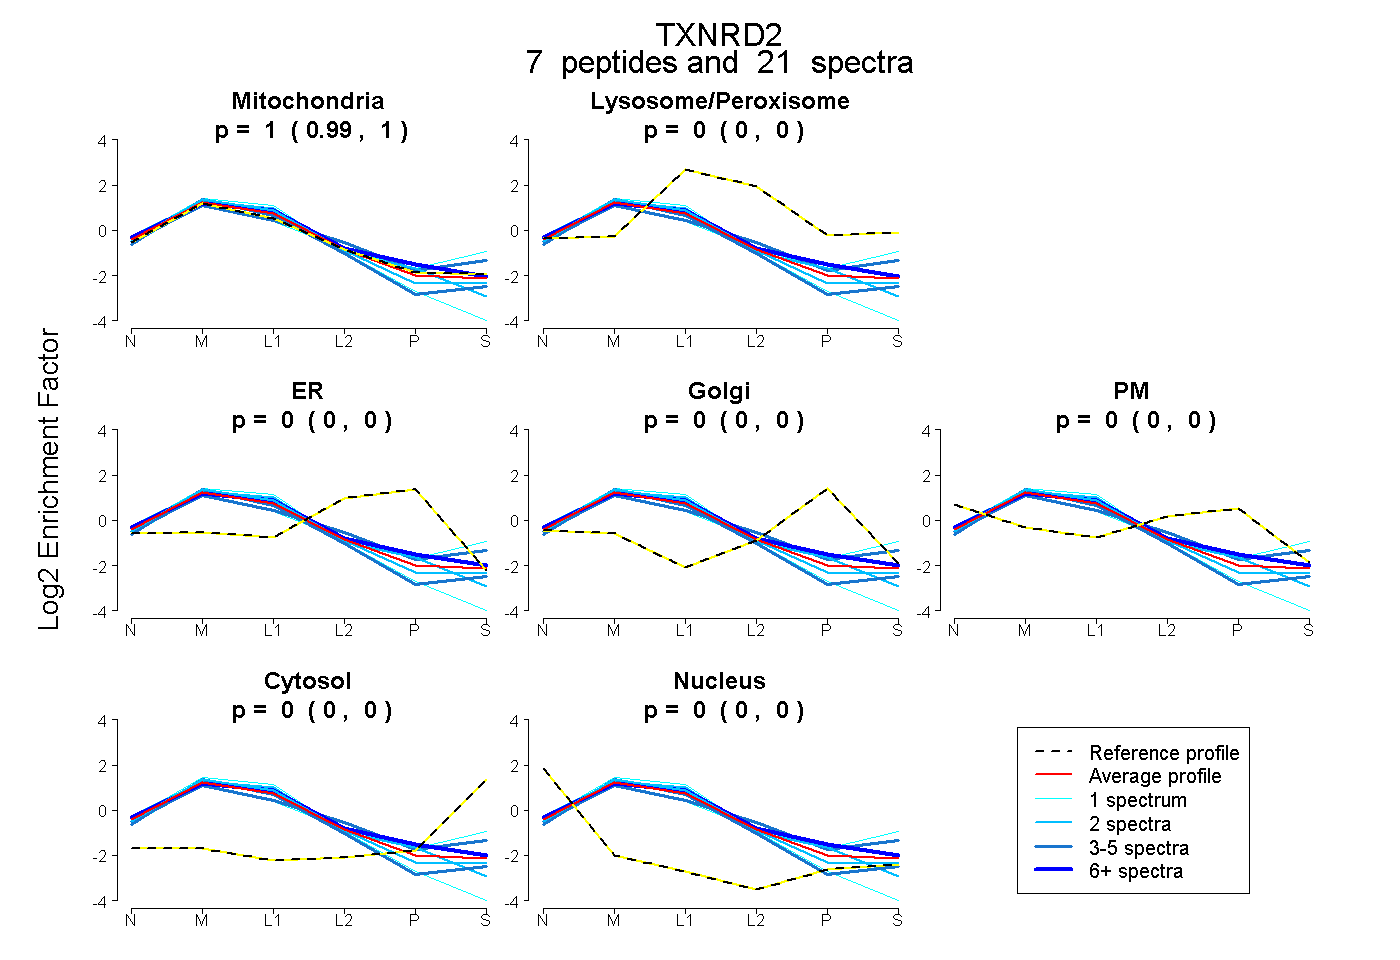 |
1.000 0.995 | 1.000 |
0.000 0.000 | 0.003 |
0.000 0.000 | 0.000 |
0.000 0.000 | 0.000 |
0.000 0.000 | 0.000 |
0.000 0.000 | 0.000 |
0.000 0.000 | 0.000 |
|||
| Plot | Lyso | Other | |||||||||||
| Expt C |
19 peptides |
246 spectra |
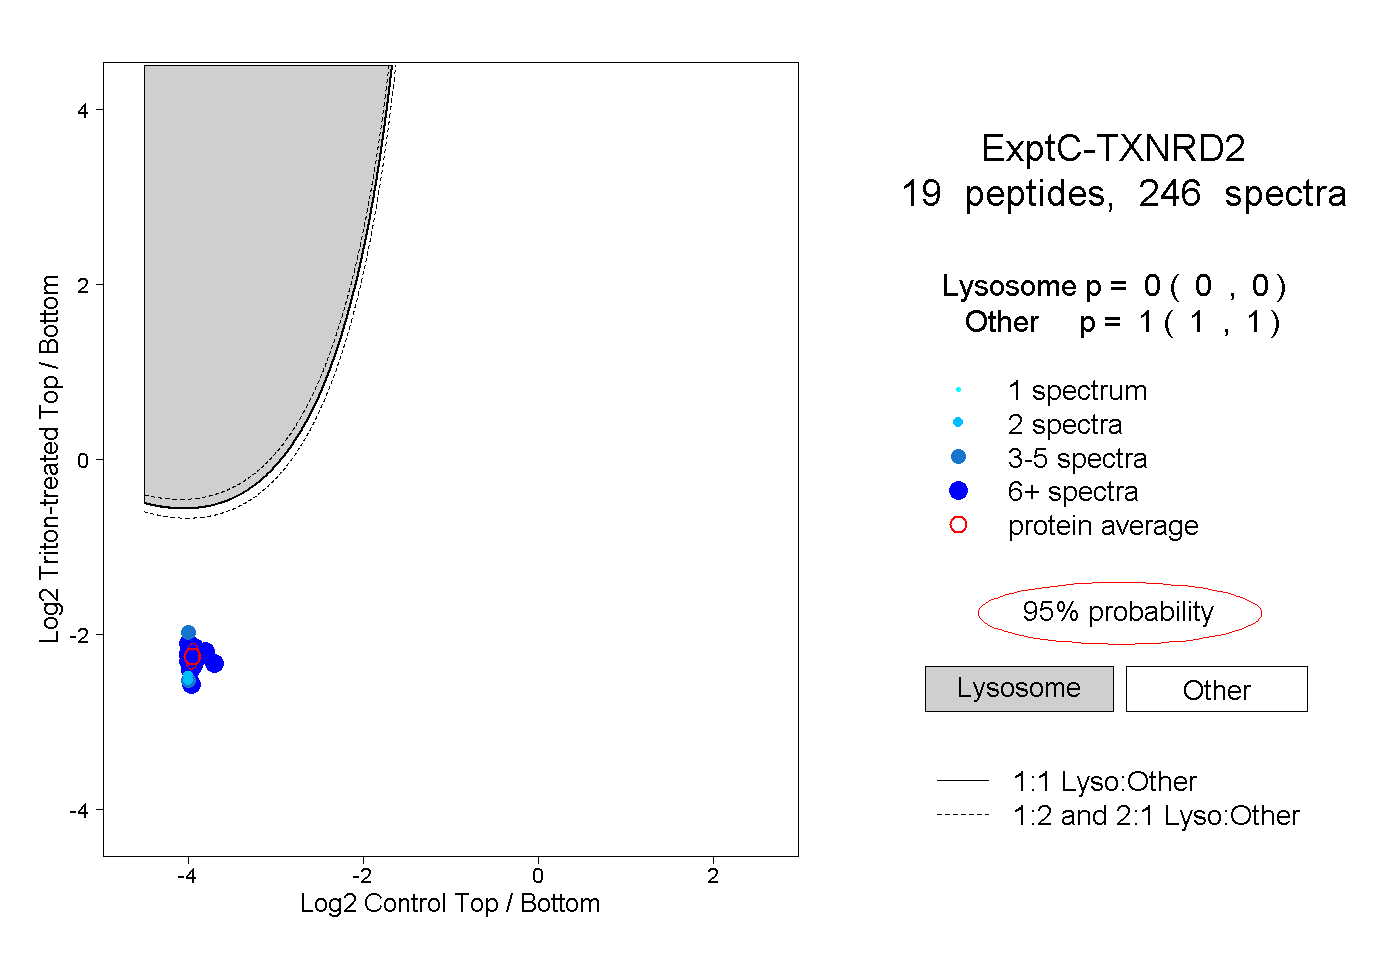 |
0.000 0.000 | 0.000 |
1.000 1.000 | 1.000 |
||||||||
| Plot | Lyso | Other | |||||||||||
| Expt D |
8 peptides |
19 spectra |
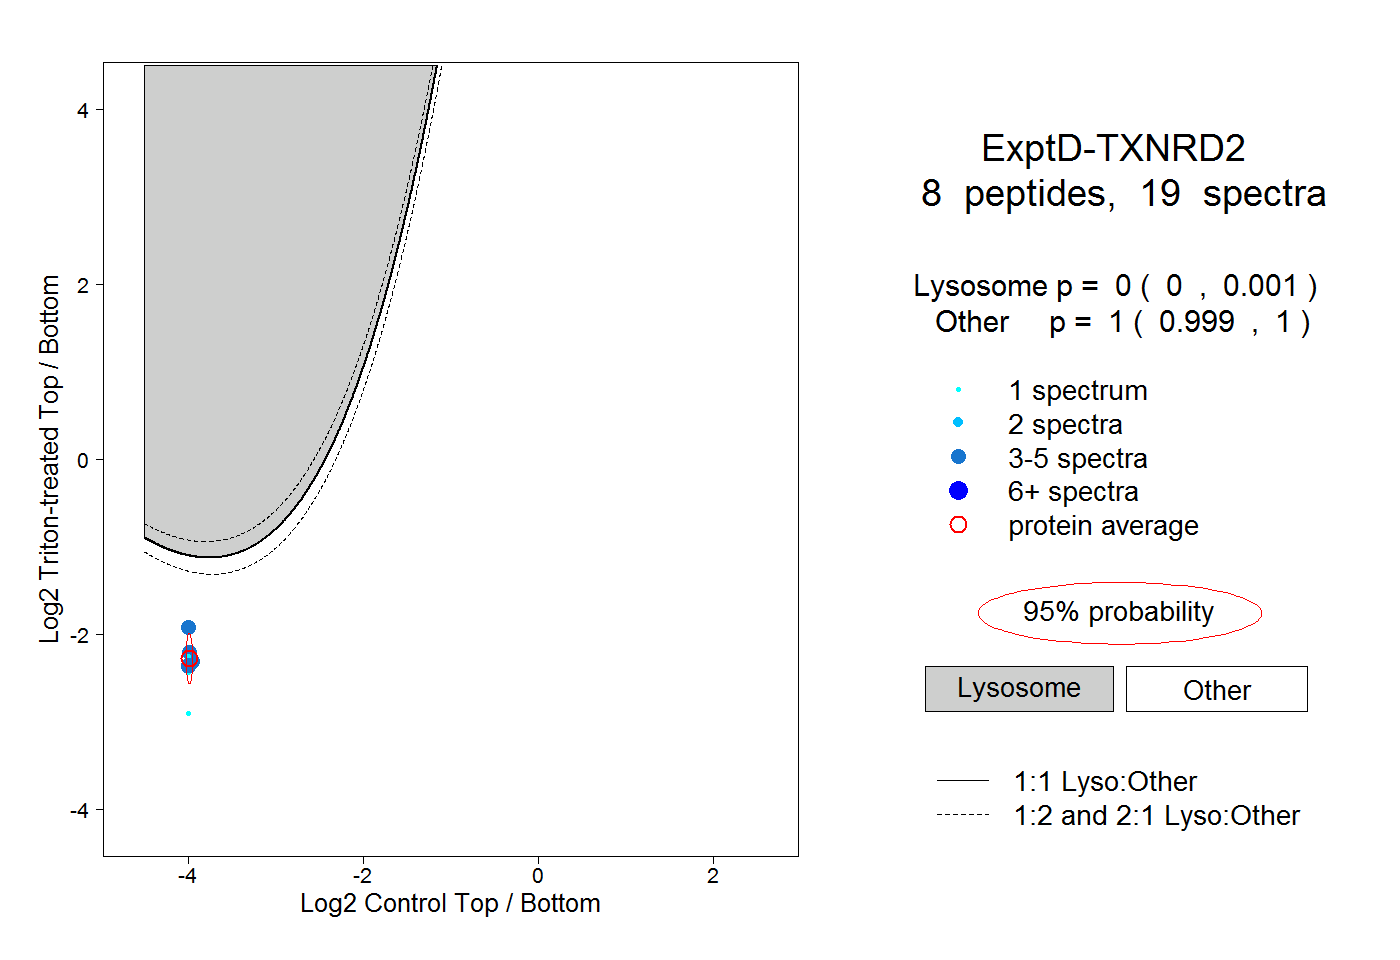 |
0.000 0.000 | 0.001 |
1.000 0.999 | 1.000 |