 27
27peptides
spectra
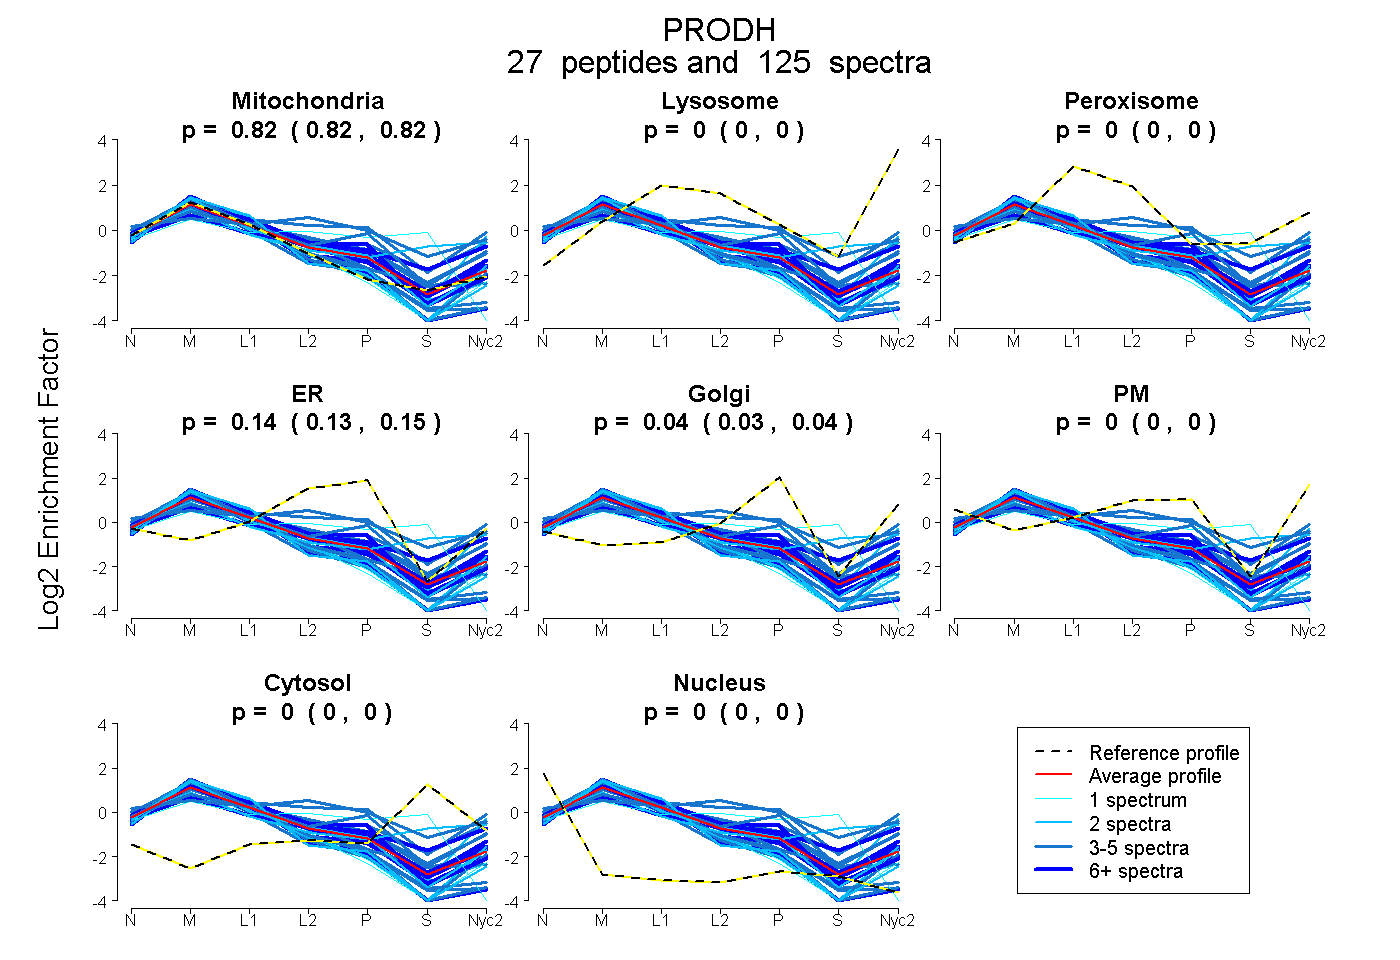
0.817 | 0.824
0.000 | 0.000
0.000 | 0.000
0.134 | 0.152
0.025 | 0.044
0.000 | 0.000
0.000 | 0.000
0.000 | 0.000
18peptides
spectra
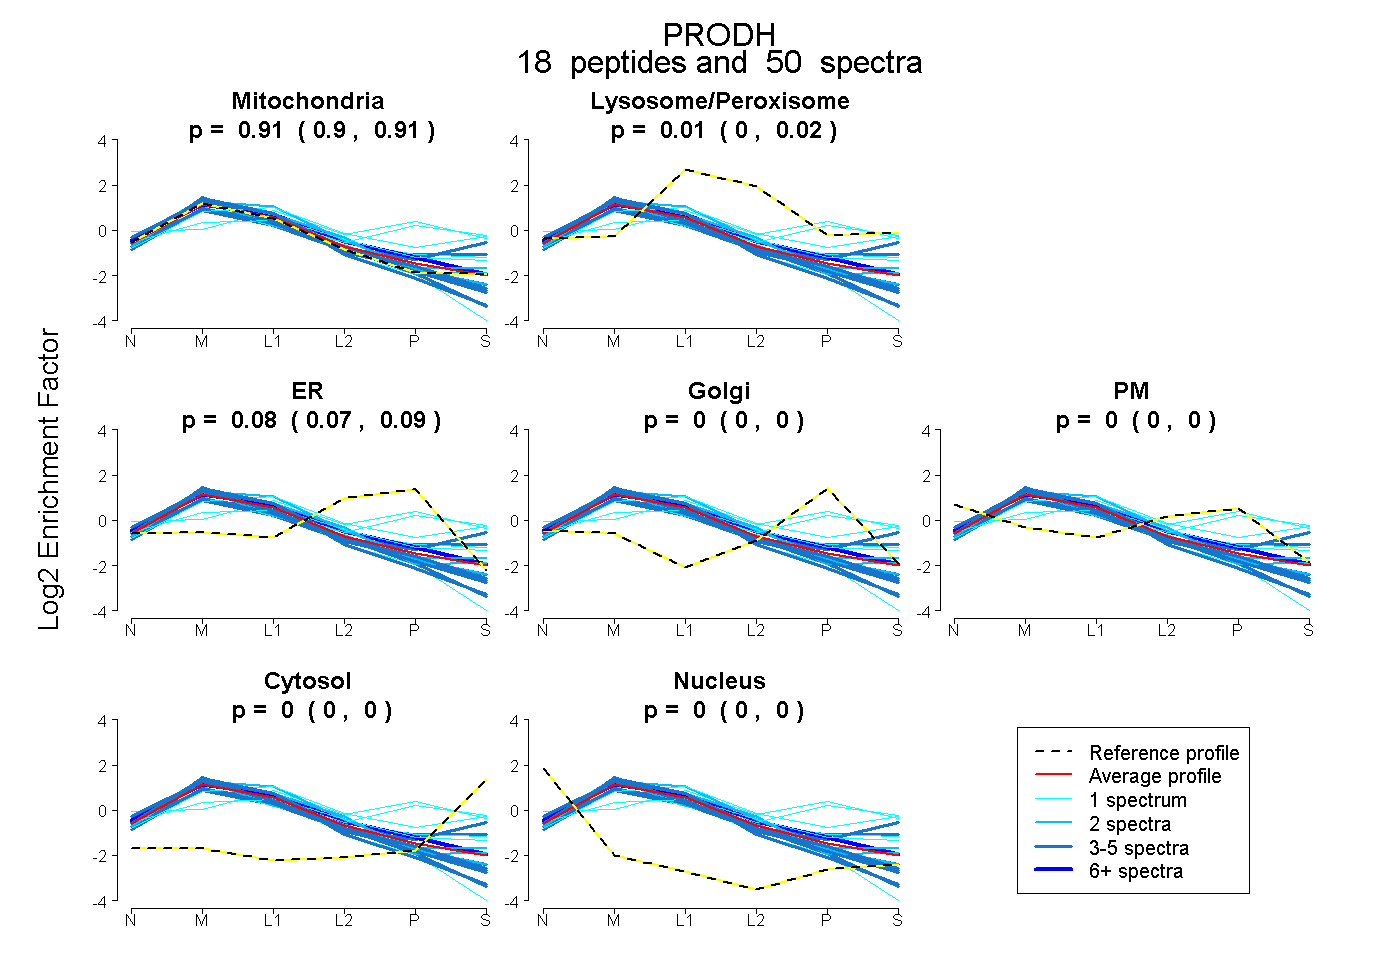
0.899 | 0.912
0.003 | 0.020
0.071 | 0.089
0.000 | 0.000
0.000 | 0.000
0.000 | 0.000
0.000 | 0.000
26peptides
spectra
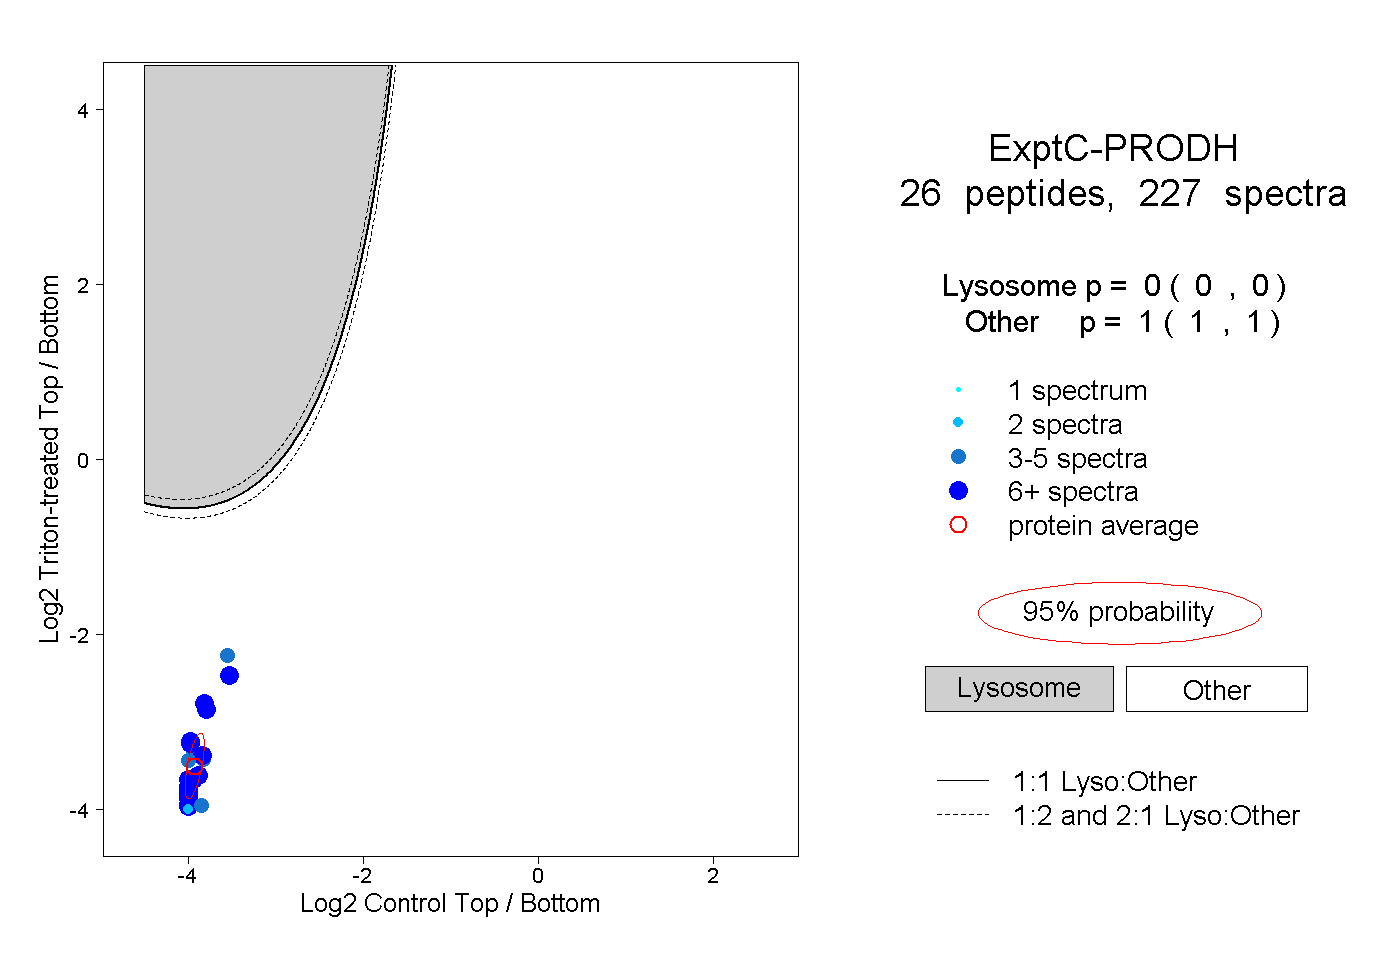
0.000 | 0.000
1.000 | 1.000
14peptides
spectra
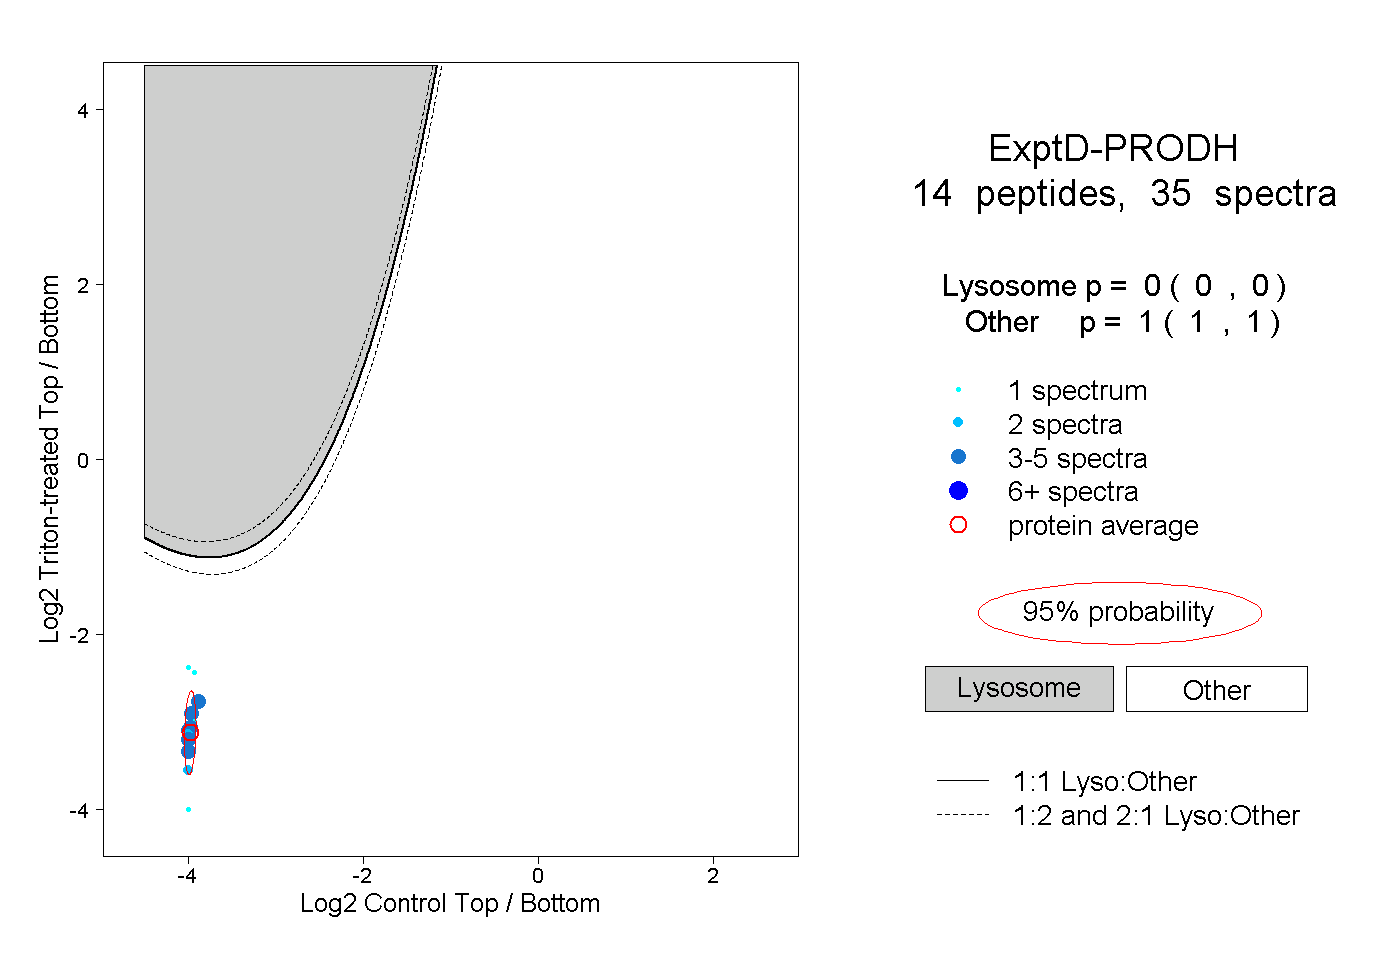
0.000 | 0.000
1.000 | 1.000