 2
2peptides
spectra
0.000 | 0.000
0.000 | 0.000
0.000 | 0.042
0.192 | 0.686
0.000 | 0.212
0.000 | 0.000
0.000 | 0.183
0.225 | 0.474
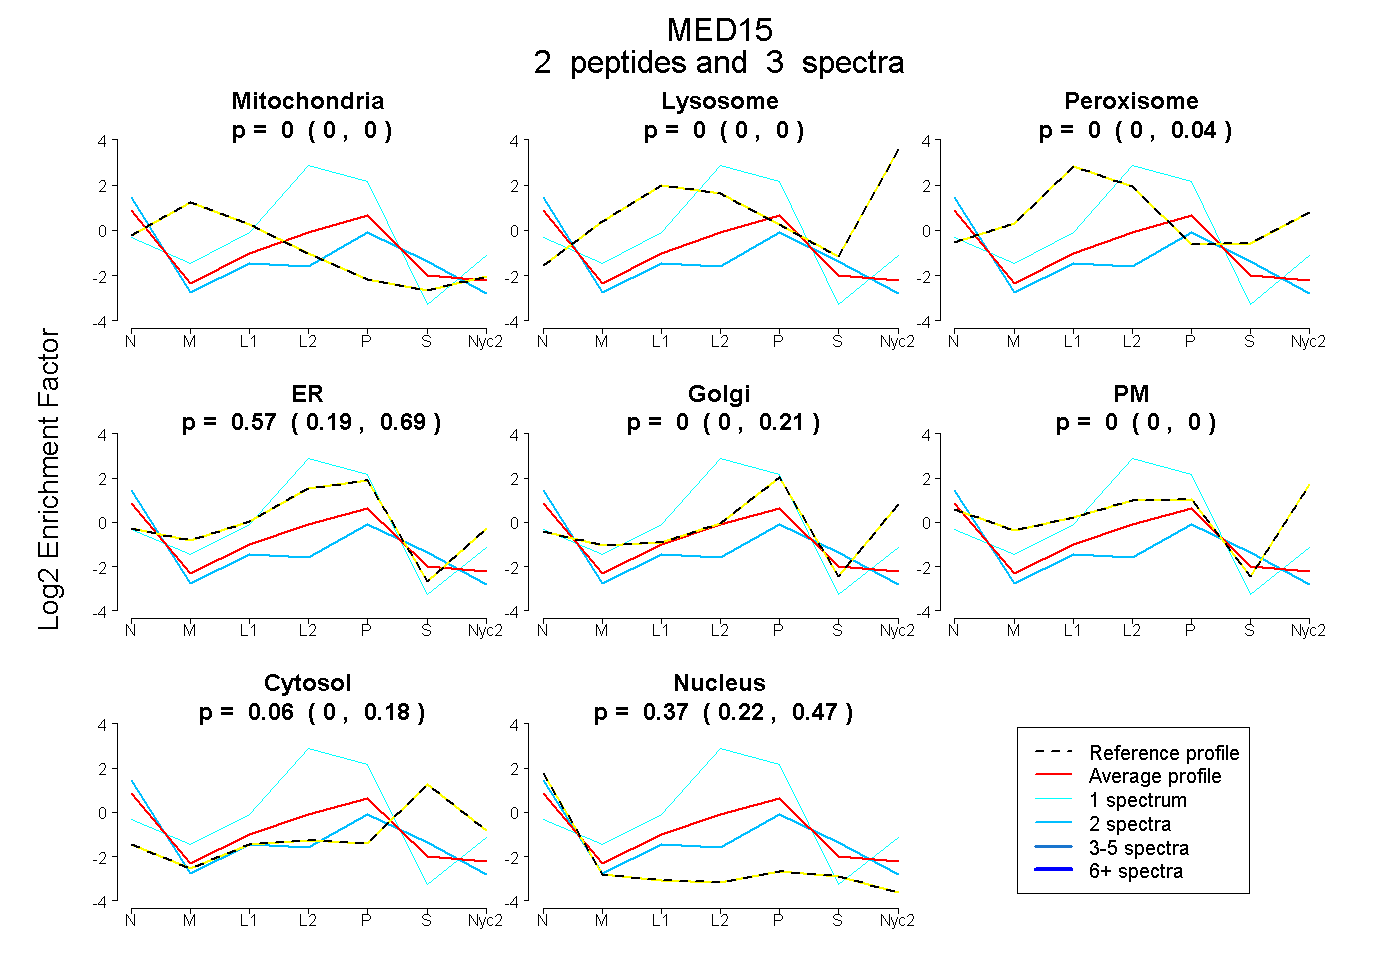
| Plot | Mito | Lyso | Perox | ER | Golgi | PM | Cytosol | Nucleus | |||||
| Expt A |
2 peptides |
3 spectra |
|
0.000 0.000 | 0.000 |
0.000 0.000 | 0.000 |
0.000 0.000 | 0.042 |
0.570 0.192 | 0.686 |
0.000 0.000 | 0.212 |
0.000 0.000 | 0.000 |
0.062 0.000 | 0.183 |
0.368 0.225 | 0.474 |
| 2 spectra, LIIHFR | 0.000 | 0.000 | 0.000 | 0.297 | 0.000 | 0.000 | 0.171 | 0.531 | ||
| 1 spectrum, LLQLPDK | 0.000 | 0.000 | 0.000 | 1.000 | 0.000 | 0.000 | 0.000 | 0.000 |
| Plot | Mito | Lyso or Perox | ER | Golgi | PM | Cytosol | Nucleus | ||||||
| Expt B |
2 peptides |
2 spectra |
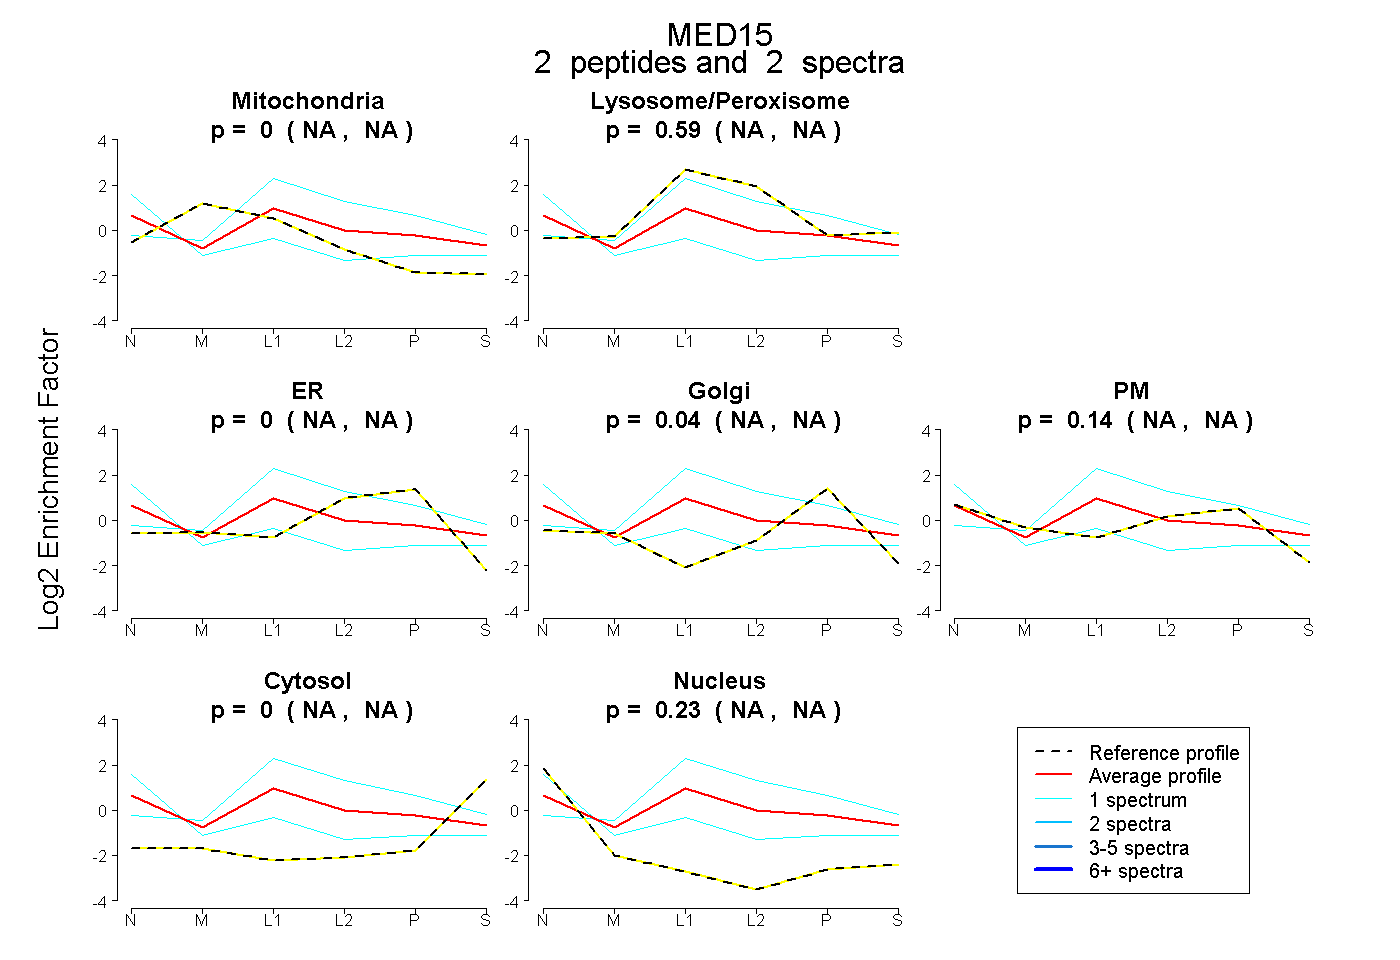 |
0.000 NA | NA |
0.588 NA | NA |
0.000 NA | NA |
0.039 NA | NA |
0.138 NA | NA |
0.000 NA | NA |
0.235 NA | NA |