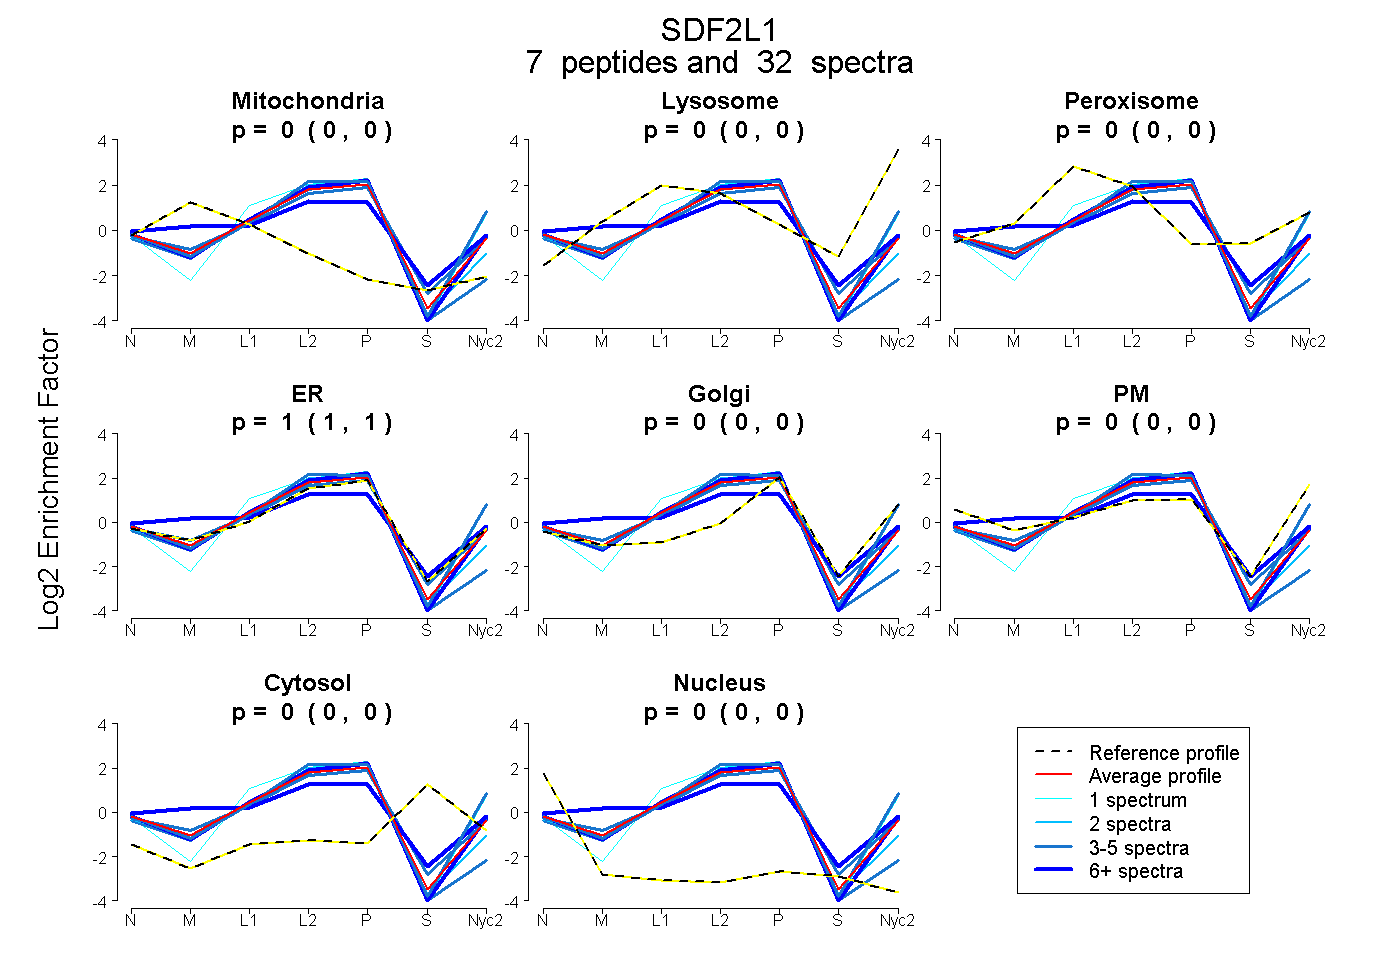
 7
7peptides
spectra
0.000 | 0.000
0.000 | 0.000
0.000 | 0.000
1.000 | 1.000
0.000 | 0.000
0.000 | 0.000
0.000 | 0.000
0.000 | 0.000
| Plot | Mito | Lyso | Perox | ER | Golgi | PM | Cytosol | Nucleus | |||||
| Expt A |
7 peptides |
32 spectra |
|
0.000 0.000 | 0.000 |
0.000 0.000 | 0.000 |
0.000 0.000 | 0.000 |
1.000 1.000 | 1.000 |
0.000 0.000 | 0.000 |
0.000 0.000 | 0.000 |
0.000 0.000 | 0.000 |
0.000 0.000 | 0.000 |
| 3 spectra, ASAGLVTCGSVLK | 0.000 | 0.000 | 0.000 | 0.956 | 0.000 | 0.000 | 0.000 | 0.044 | ||
| 5 spectra, LTHVLTGK | 0.000 | 0.004 | 0.000 | 0.771 | 0.000 | 0.225 | 0.000 | 0.000 | ||
| 11 spectra, LLNTHHR | 0.141 | 0.000 | 0.067 | 0.646 | 0.000 | 0.146 | 0.000 | 0.000 | ||
| 1 spectrum, AMEGIFIKPGADPSTGHDEL | 0.000 | 0.023 | 0.000 | 0.899 | 0.000 | 0.078 | 0.000 | 0.000 | ||
| 7 spectra, GGSEGGCPR | 0.000 | 0.000 | 0.000 | 1.000 | 0.000 | 0.000 | 0.000 | 0.000 | ||
| 2 spectra, CGQAVR | 0.000 | 0.000 | 0.000 | 1.000 | 0.000 | 0.000 | 0.000 | 0.000 | ||
| 3 spectra, LHSHDIK | 0.000 | 0.000 | 0.018 | 0.982 | 0.000 | 0.000 | 0.000 | 0.000 |
| Plot | Mito | Lyso or Perox | ER | Golgi | PM | Cytosol | Nucleus | ||||||
| Expt B |
4 peptides |
11 spectra |
 |
0.000 0.000 | 0.000 |
0.033 0.006 | 0.057 |
0.967 0.939 | 0.989 |
0.000 0.000 | 0.000 |
0.000 0.000 | 0.000 |
0.000 0.000 | 0.000 |
0.000 0.000 | 0.000 |
|||
| Plot | Lyso | Other | |||||||||||
| Expt C |
5 peptides |
22 spectra |
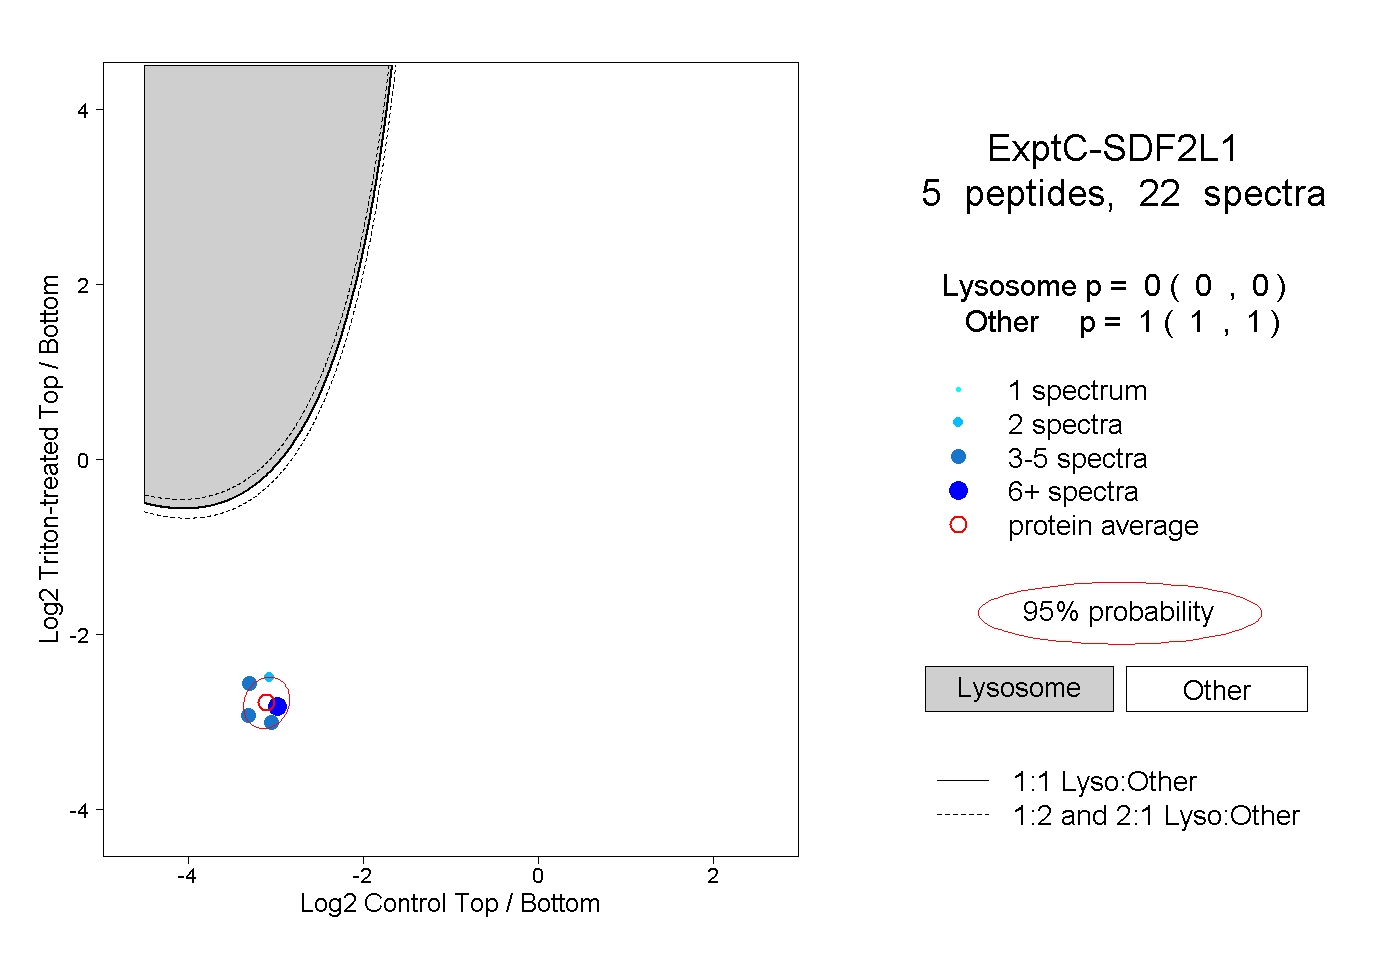 |
0.000 0.000 | 0.000 |
1.000 1.000 | 1.000 |
||||||||
| Plot | Lyso | Other | |||||||||||
| Expt D |
3 peptides |
8 spectra |
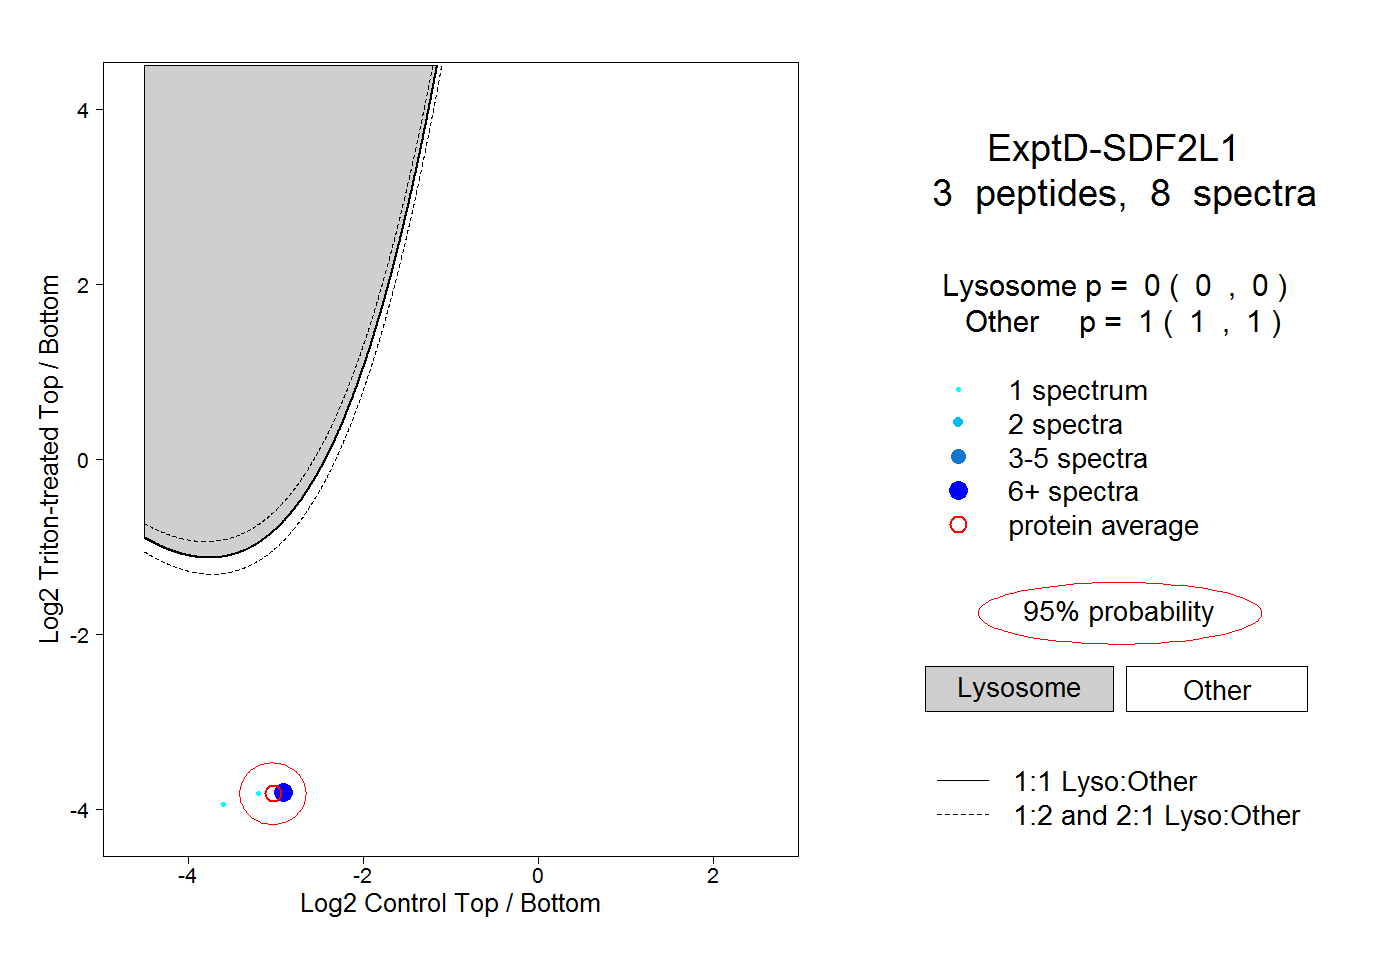 |
0.000 0.000 | 0.000 |
1.000 1.000 | 1.000 |