 5
5peptides
spectra
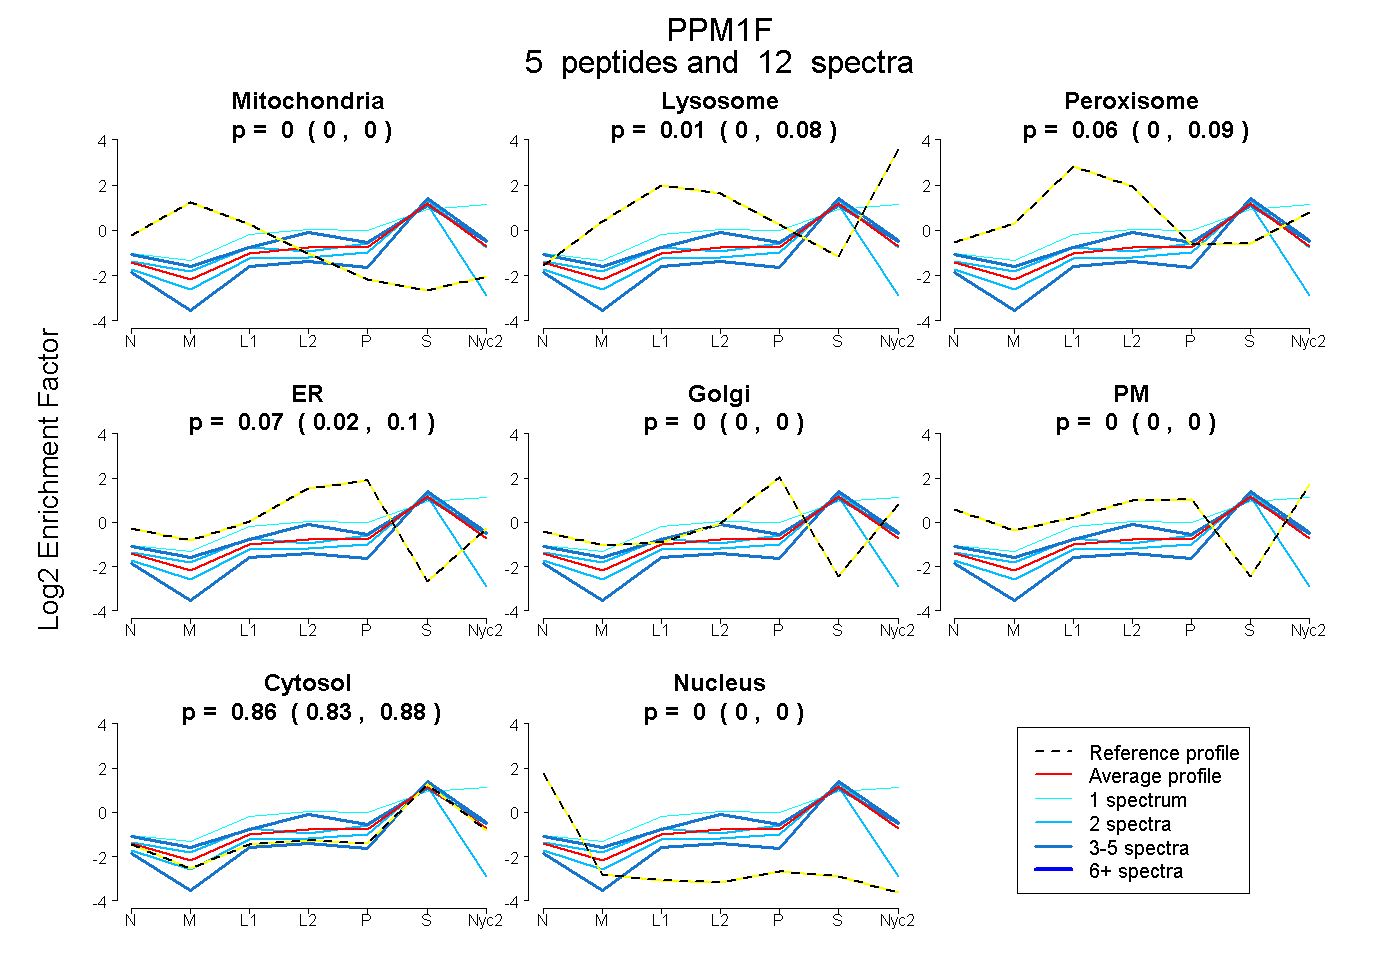
0.000 | 0.000
0.000 | 0.080
0.000 | 0.088
0.017 | 0.097
0.000 | 0.005
0.000 | 0.000
0.835 | 0.881
0.000 | 0.000
1peptide
spectra
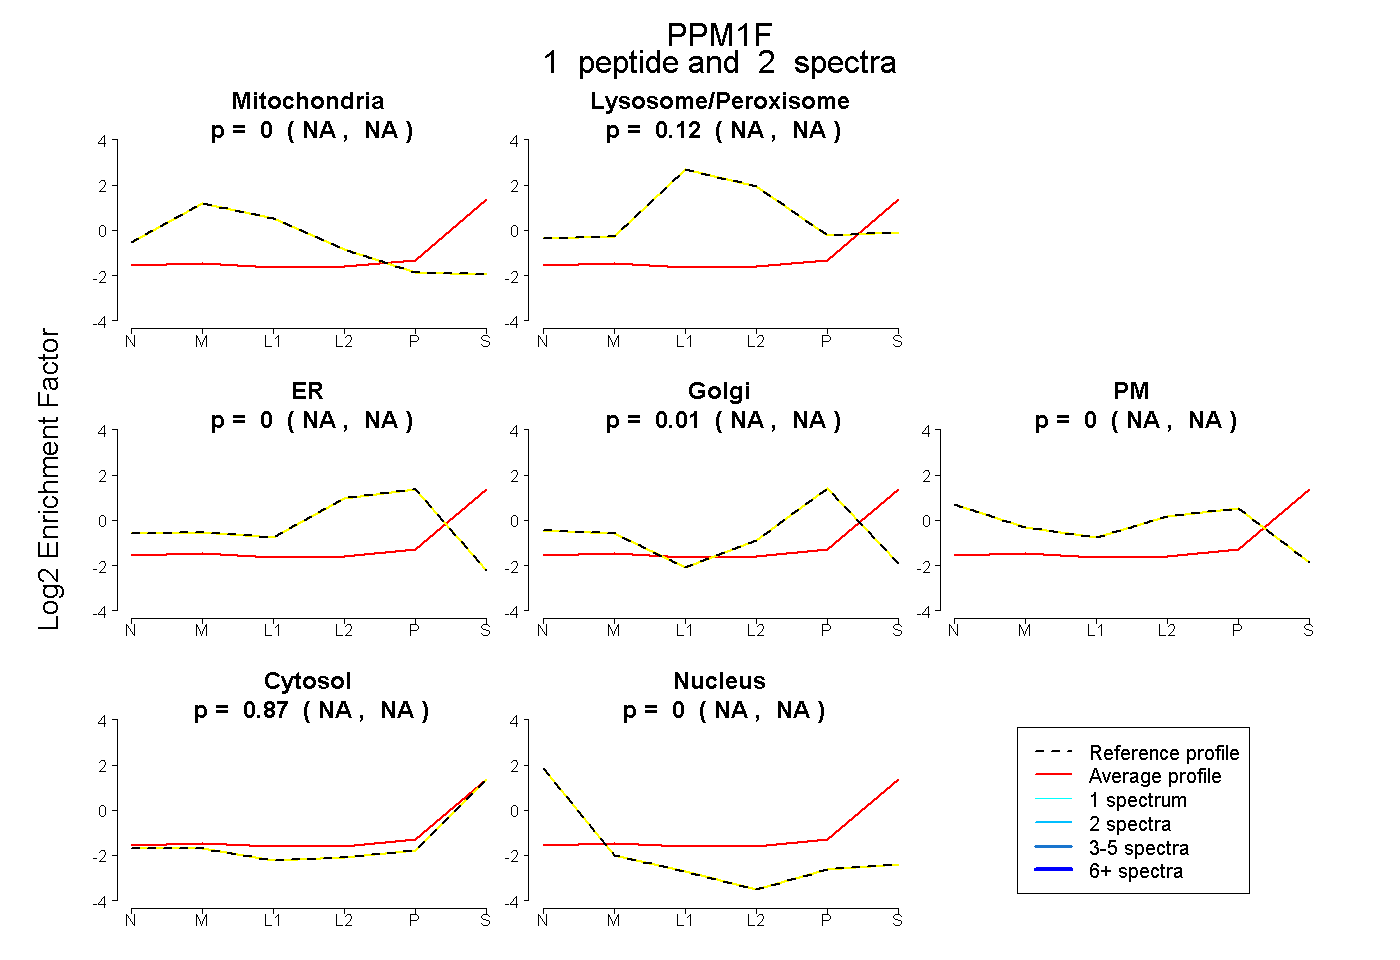
NA | NA
NA | NA
NA | NA
NA | NA
NA | NA
NA | NA
NA | NA
5peptides
spectra
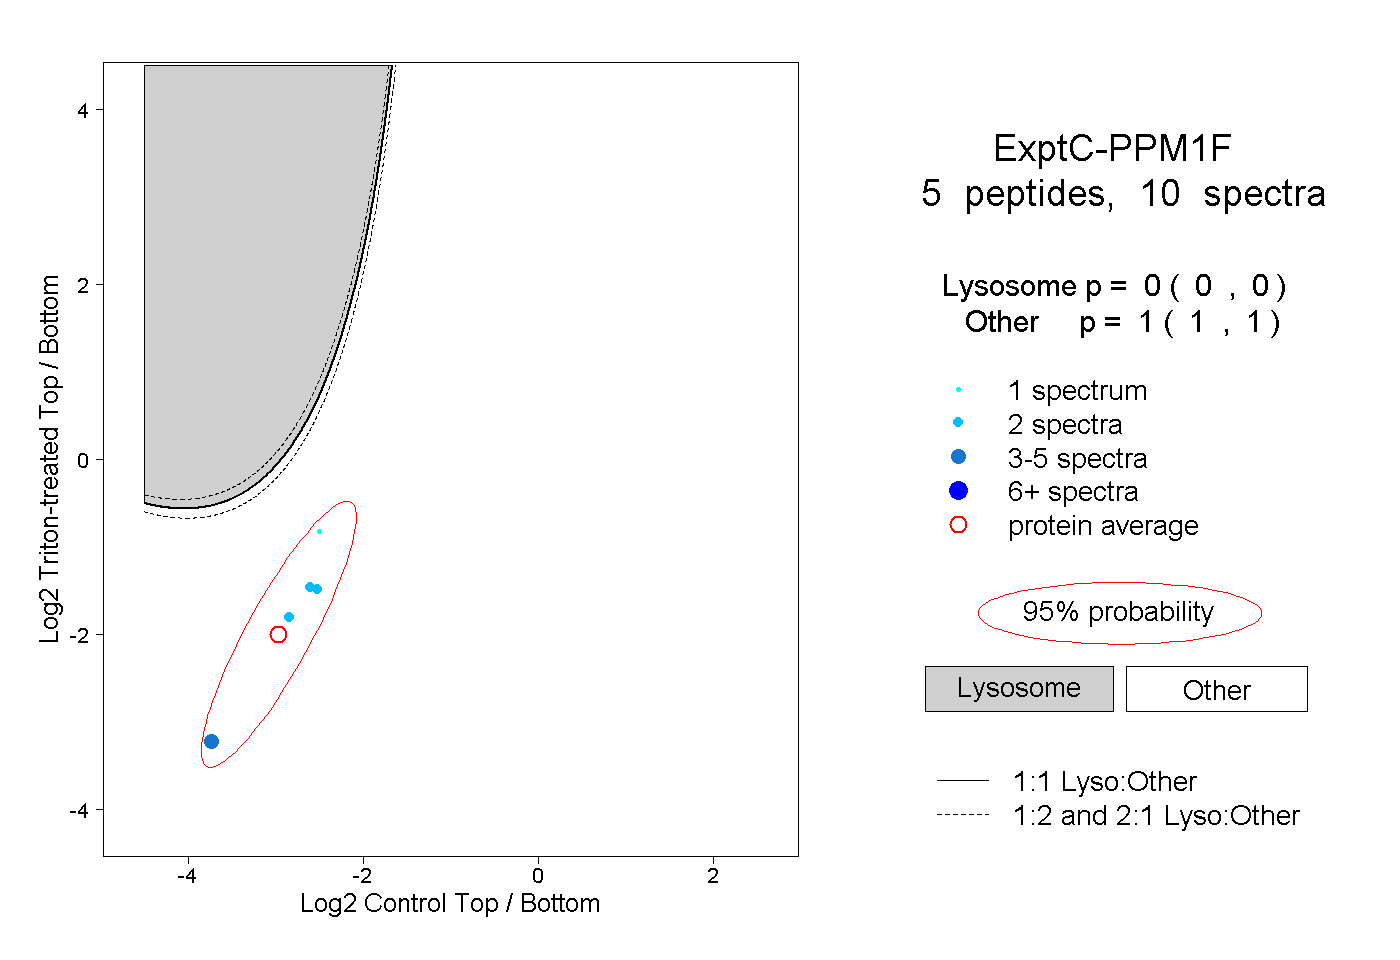
0.000 | 0.000
1.000 | 1.000